Quantile balancing
For MoE architectures, a key concern is experts vanishing and becoming redundant, resulting in wasted FLOPs and memory while hurting performance. In an ideal case, experts would be at 100% utilisation and specialise in different domains or aspects of language modelling. Recent latent fine-grained MoE architectures scaled up experts to ~900 (Kimi K3). A key reason for this is quantile balancing, a loss-free method introduced and used for expert balancing.
MoE overview
Rather than having a fixed feed-forward layer in our model, what if we could have many and cleverly route each token? It would give us more capacity without increased FLOPs. That is what MoEs try to achieve and the key component in a MoE architecture is the router. It's a learned linear projection that takes as input the token vector and outputs a vector of length equal to the number of experts, which represents the expert scores; we refer to these as the logits. If we route each token to three experts (top-3), we use the index positions of the top three logits to route the token to. For example, if the 10th, 113th and 89th index positions of the assignment vector have the largest values, these are the three experts we route to. The token is then multiplied by the weight matrices of each selected expert and the output from each is scaled by the softmax of the logits (to bake in how much contribution we want from each expert) and summed. The training signal to the router comes from the softmax-weight multiplication, not the assignments, as that is a non-differentiable operation.
Say we have
where
to select the index positions of the top three highest scores, as well as the scores themselves.
In code, it's implemented as follows:
# Defining a linear layer
router = nn.Linear(cfg["d_model"], cfg["num_experts"], bias=False)

# Logit scores
# x is our model's hidden state
# [b, t, d_model] -> [b, t, num_experts]
scores = router(x)

# torch.topk returns the top k values and
# their indices
topk_scores, topk_indices = torch.topk(scores, k=3)

# Softmax the top k logits
# to get probs to scale outputs with
topk_probs = torch.softmax(topk_scores, dim=-1)
How the tokens get routed efficiently is outside the scope of this post.
Mechanics of router collapse
A router collapse is a situation where tokens are being excessively assigned to a small subset of experts. This in turn means that the unselected ones do not get trained and linger around as dead parameters. It is also a self-reinforcing cycle as the router starts to prefer the excessively assigned experts as they are more trained, ensuring the expert concentration grows stronger with training.
Looking at the mechanistic cause, when a token is multiplied by the router projection, if some columns in the router weights have a significantly larger magnitude than the rest, then these router positions will be picked for all tokens, assuming the magnitude of the token vector itself isn't super small and the resulting dot product with the token vector is large.
Remedies
Several methods have been tried, starting with load-balancing losses, then bias additions and, finally, the subject of this post, quantile balancing.
Auxiliary loss-free bias balancing
Bias balancing is a simple but clever approach introduced by DeepSeek-V3. It looks at the state of current routing, and adds a small value to help underloaded experts and deter overloaded experts.
Suppose you have 4 experts, 4 tokens and top-
| Token | E1 | E2 | E3 | E4 | Selected |
|---|---|---|---|---|---|
| t1 | 0.90 | 0.75 | 0.70 | 0.50 | E1 |
| t2 | 0.70 | 0.85 | 0.80 | 0.70 | E2 |
| t3 | 0.55 | 0.60 | 0.85 | 0.80 | E3 |
| t4 | 0.65 | 0.65 | 0.90 | 0.60 | E3 |
Table 1: Token assignments.
A uniform spread would be the number of tokens divided by the number of experts, giving us 1 token per expert, but from the above, we can see that expert 1 gets 1 assignment, expert 2 gets 1, expert 3 gets 2 and expert 4 gets none, creating an imbalance.
Given that we can count the degree of imbalance, simply by looking at the difference between ideal and actual, and we know what the ideal balance should be, we can nudge the router scores towards a more even selection. We call this nudge a bias and it's computed as:
where
To correct the imbalance, when it comes to selecting our experts in the next training iteration, we now do the following for Eq. 2:
Where .detach() on the bias (in some sense, it does blindside the model). We compute the biases in one batch but apply them to the next to preserve causality. This counters any global concentration trends over the course of training.
For the example in Table 1, our
Now if we add these to our assignments from Table 1, we get:
| Token | E1 + 0 | E2 + 0 | E3 − 0.05 | E4 + 0.05 | Selected |
|---|---|---|---|---|---|
| t1 | 0.90 | 0.75 | 0.65 | 0.55 | E1 |
| t2 | 0.70 | 0.85 | 0.75 | 0.75 | E2 |
| t3 | 0.55 | 0.60 | 0.80 | 0.85 | E4 |
| t4 | 0.65 | 0.65 | 0.85 | 0.65 | E3 |
Table 2: Assignments after the bias addition.
All experts now have 1 token each, as one token switches from E3 to E4.
An issue with bias balancing is that though the direction of the update is computed from the data, the size of the update,
Quantile balancing
Quantile balancing works just like bias balancing, but it goes further to compute the magnitude of the bias from expert assignment vectors, not just the sign.
It asks the following question: For each expert, how far was it from being selected in the top-k for each token, and what values would I need to add to this expert so it can have its fair share?
This means we need a distance from selection per token, per expert. We call this distance the margin,
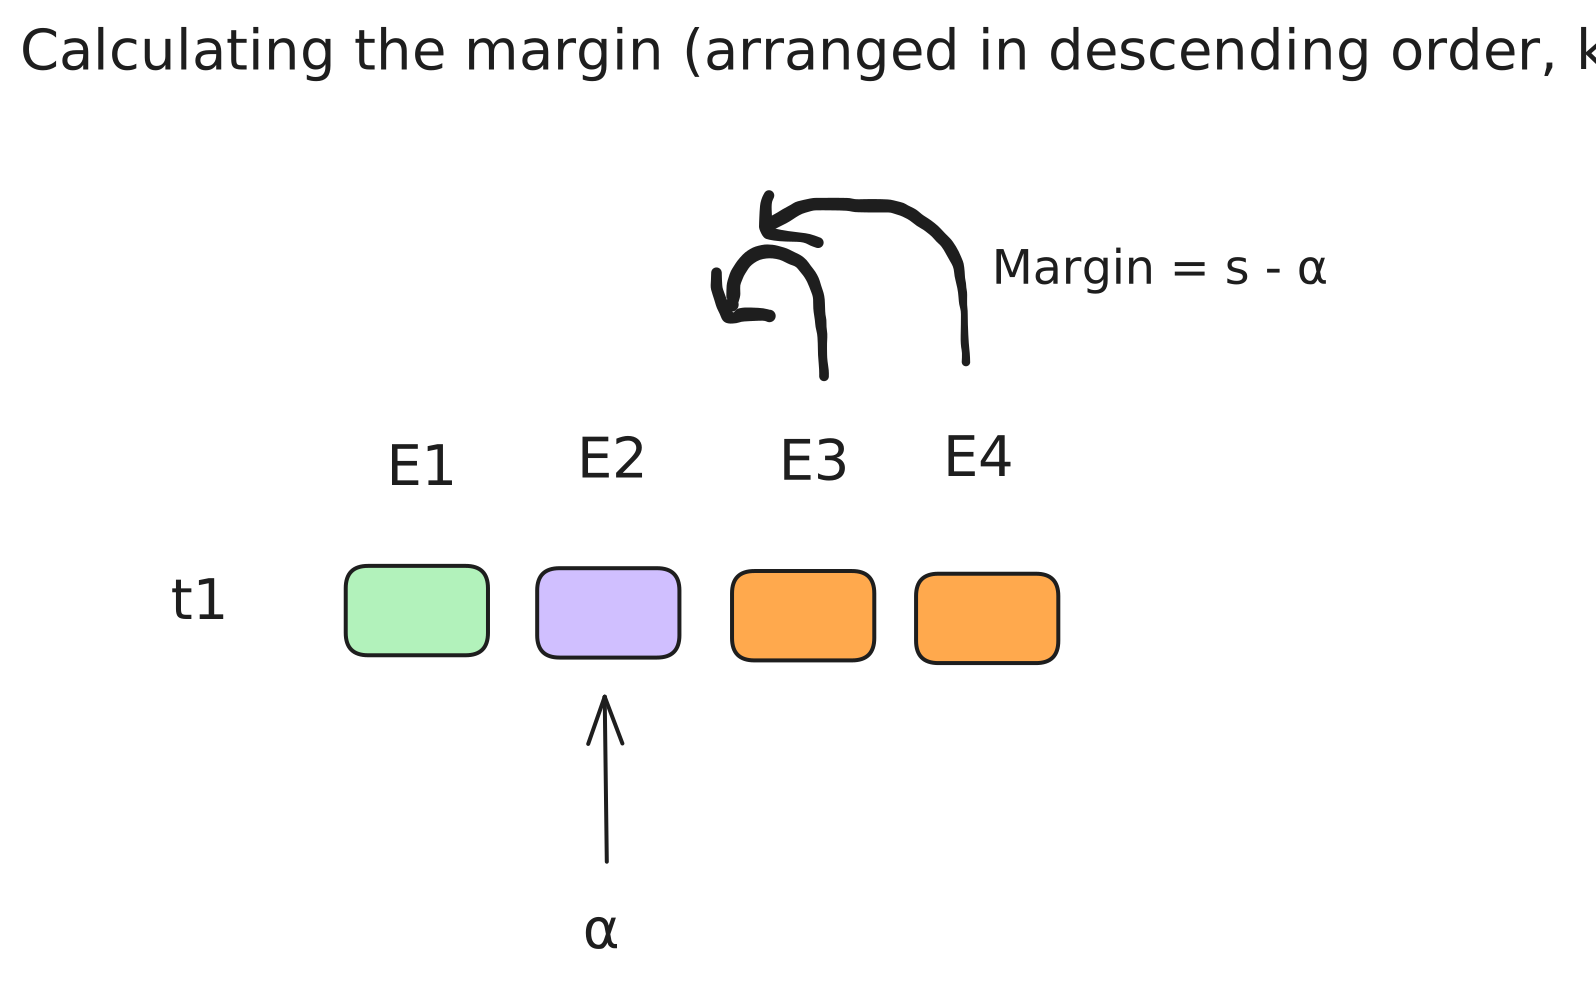
Figure 1: Calculating the cut-off and margin. Green is the assigned expert; orange and purple are the unassigned experts.
Where
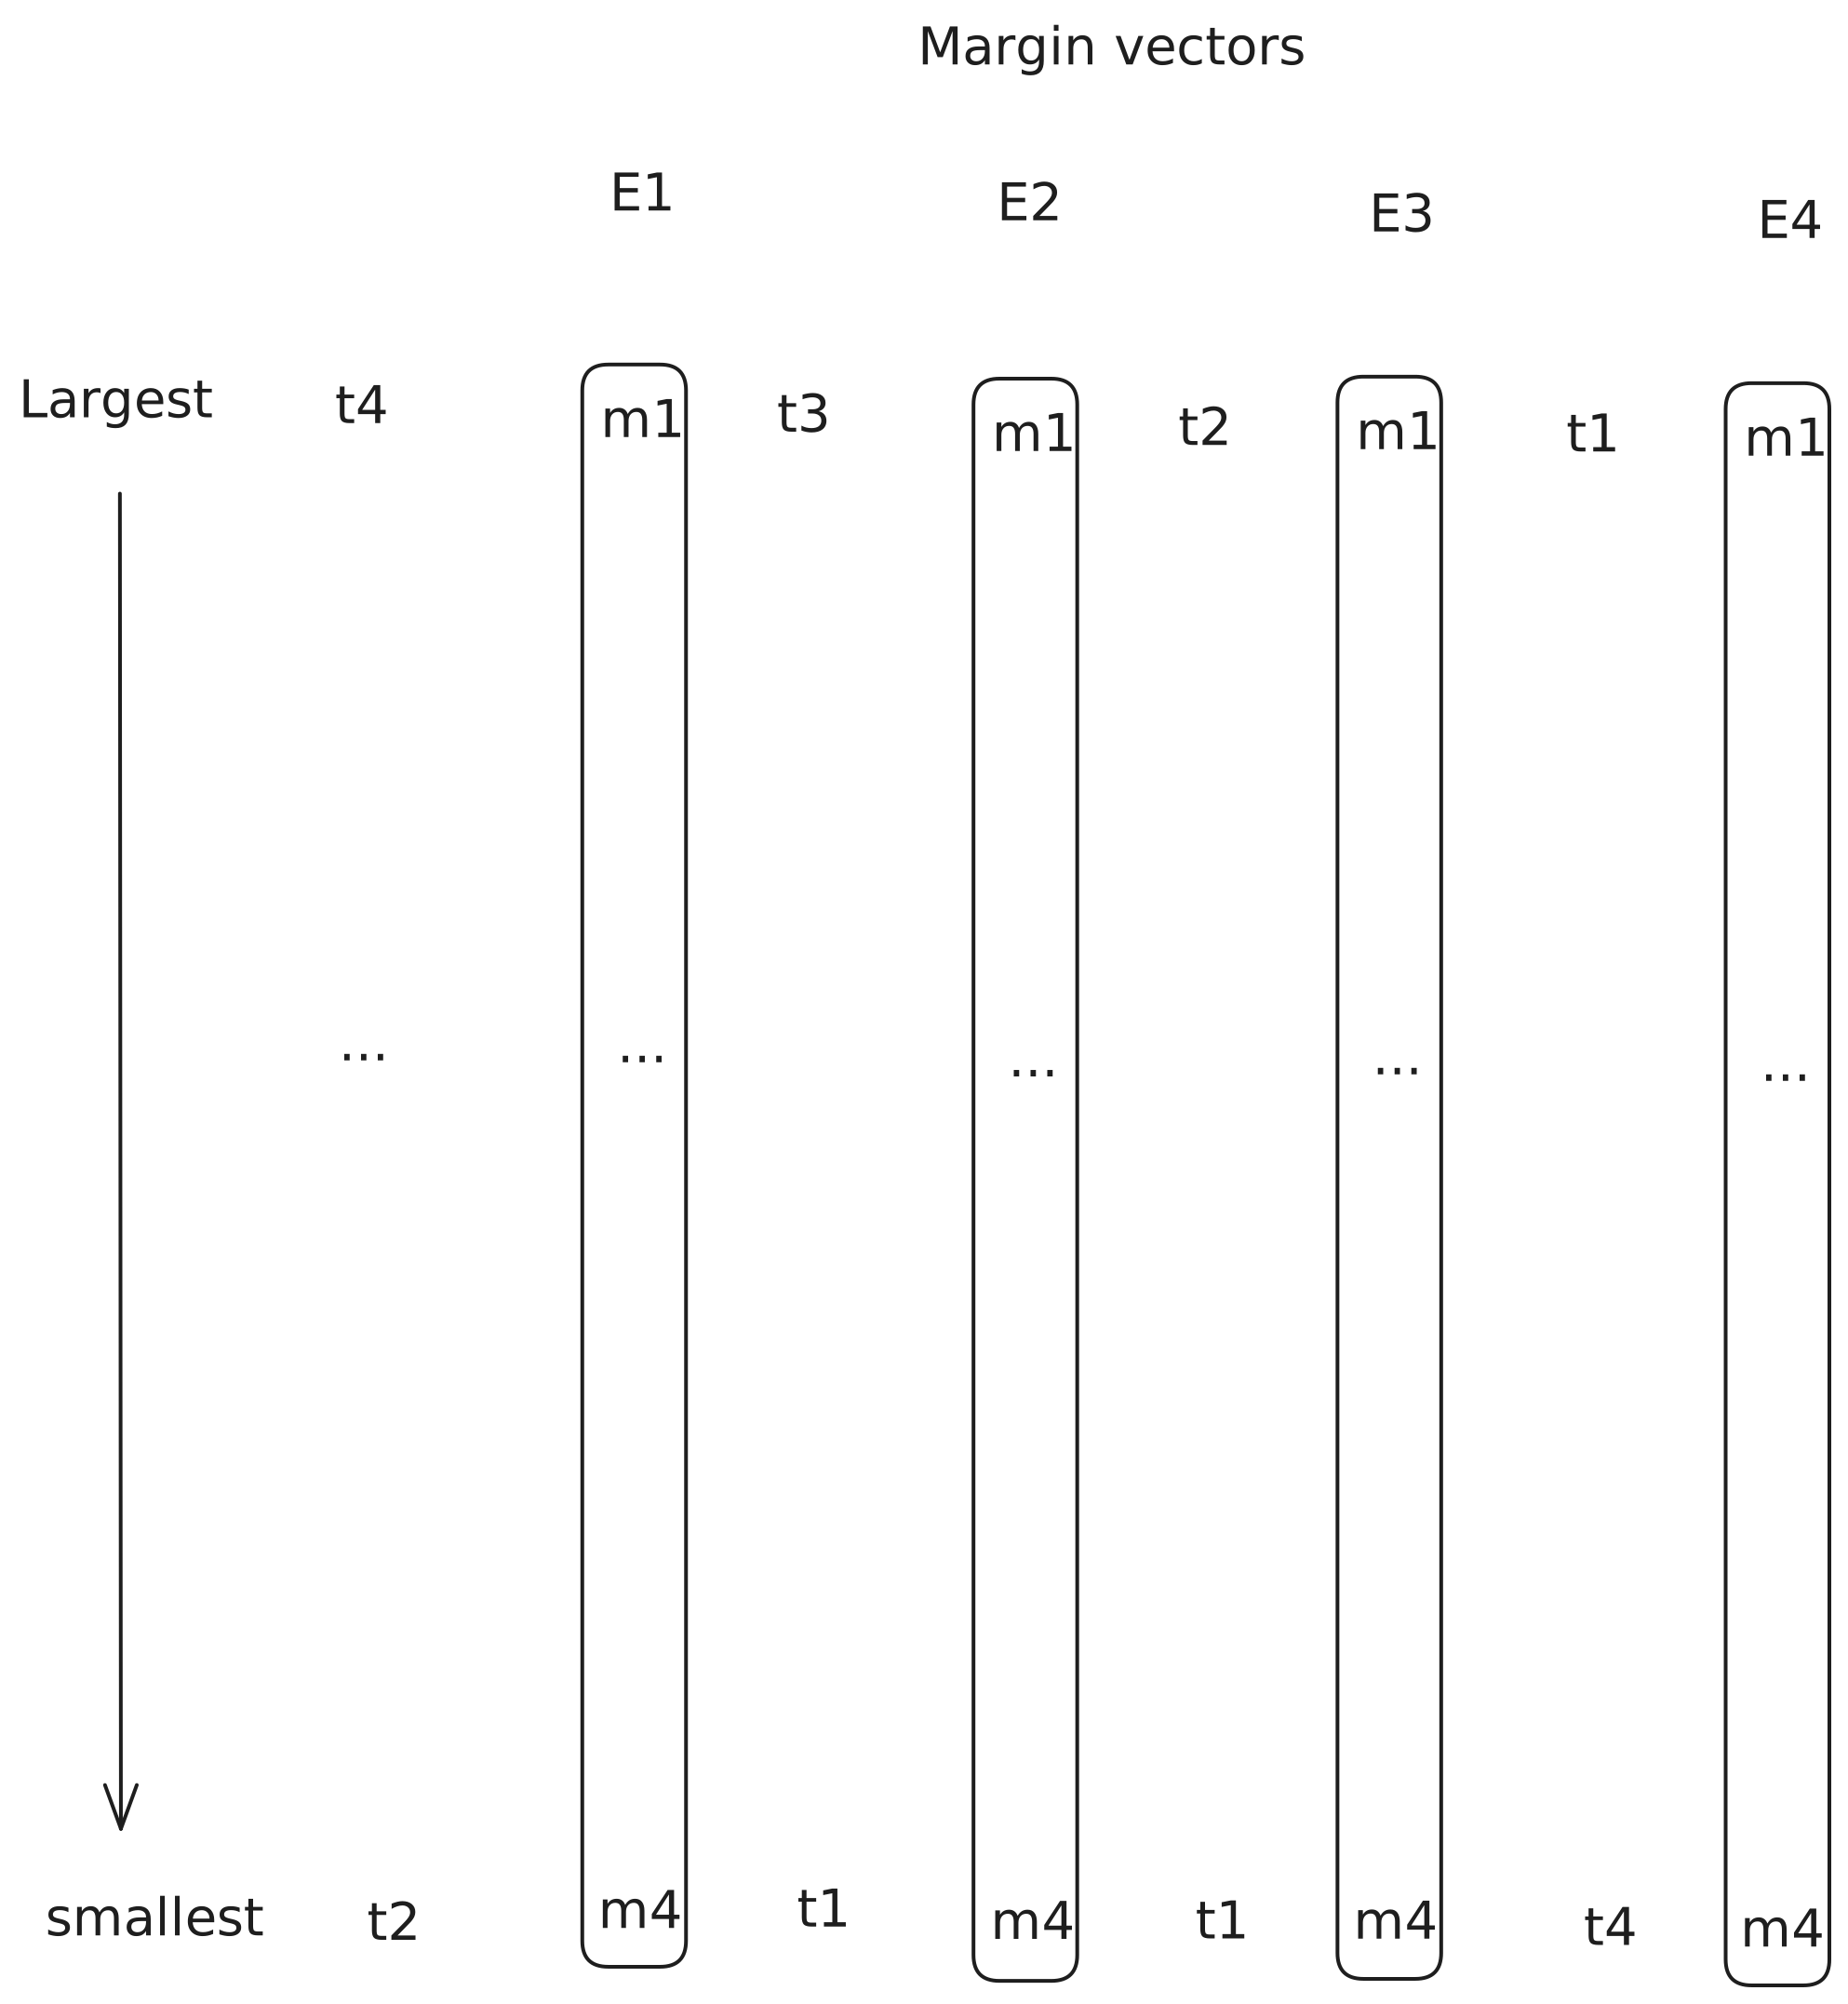
Figure 2: Margin vectors for our experts.
For each expert's margin vector, we would have positive values and negative values. The positives would be where it was selected for that token and the negatives would be where it missed out by the margin amount. The point at which the values cross from positive to negative is known as the pivot point. Figure 3 shows how to interpret the margin vector.
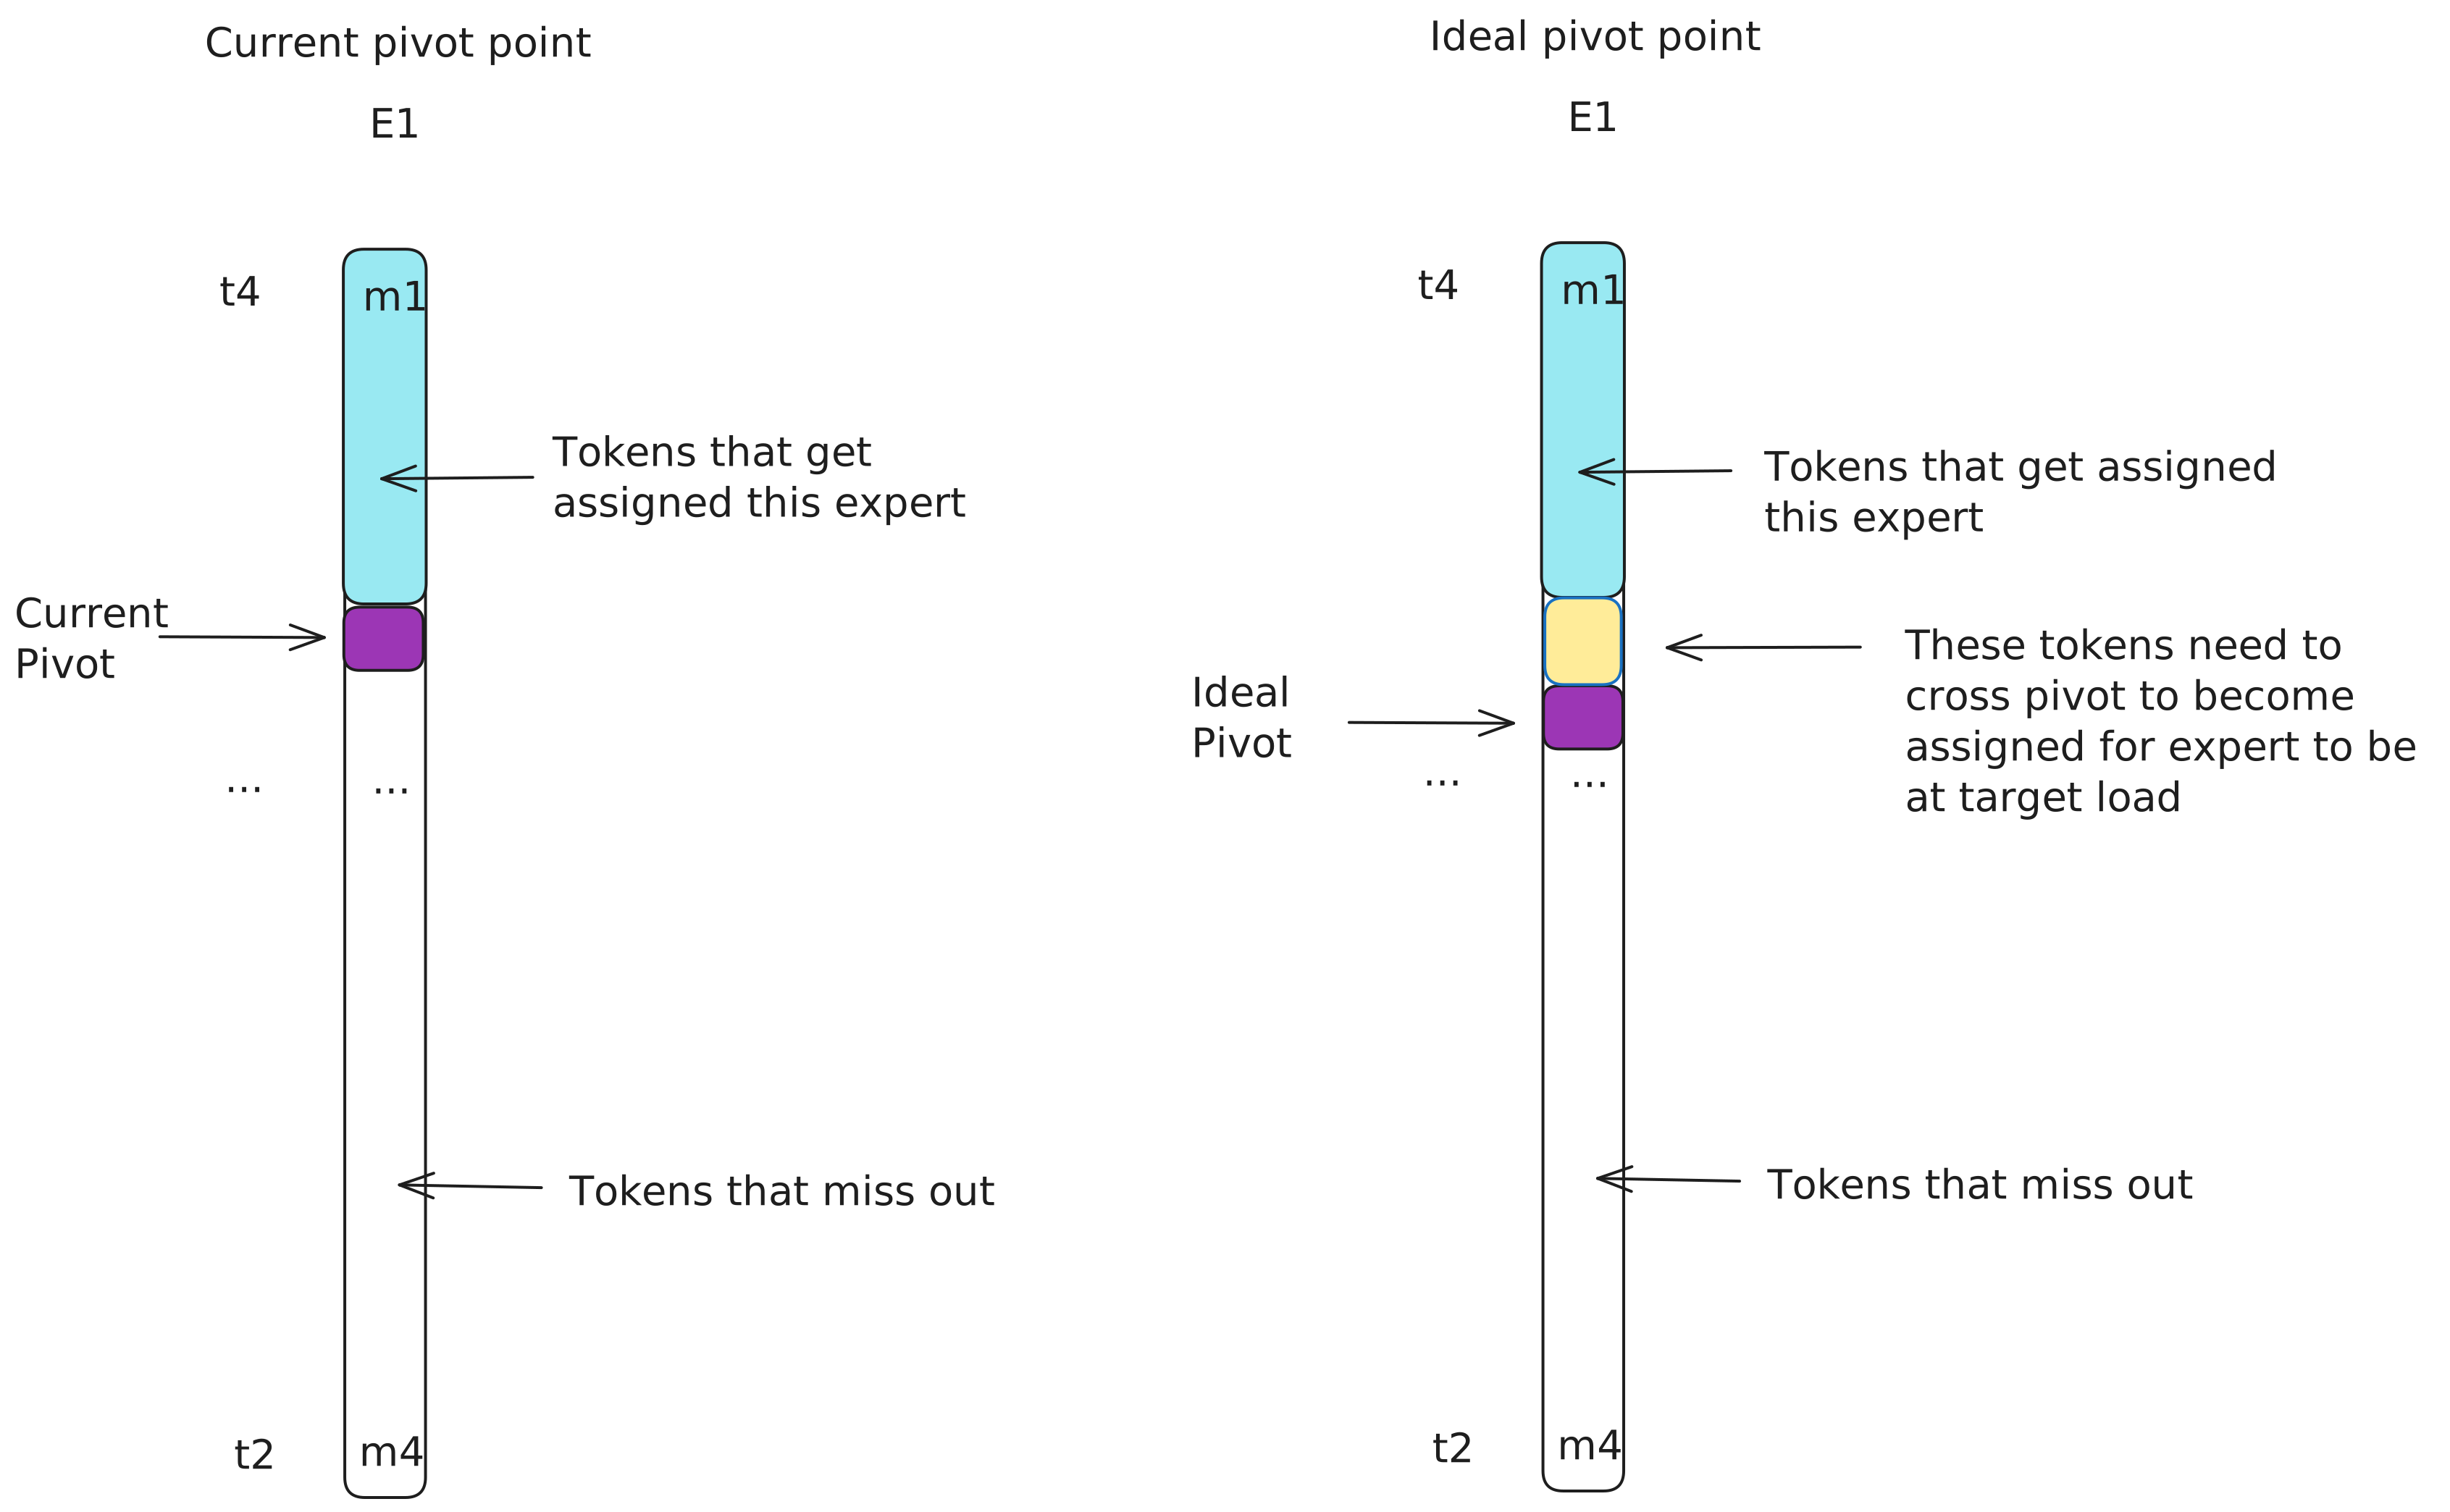
Figure 3: Changing the pivot point of the margin vector helps us balance this expert.
We have now answered the first part of our question, and we can move on to the second, what value would I need to add for each expert to get its fair share. Given 4 experts and 4 tokens with
So each expert needs 1 token, which is 25% of the tokens, and turning that into a percentile is:
So for each expert, we would want to have the ideal pivot point at the 75th percentile. As we can see from Figure 3, we have an initial pivot point for our unbalanced expert and we would like a new pivot point which leads to a balanced expert. This point is:
where
We do this for each expert to get four bias values, one per expert. We can then add these to each token in the next batch to help balance allocations.
Unlike loss-free bias balancing, we do not compute an update to the biases, but new total biases. To continue the numerical example from Table 1, we have
| Token | E1 | E2 | E3 | E4 | |
|---|---|---|---|---|---|
| t1 | 0.90 | 0.75 | 0.70 | 0.50 | 0.75 |
| t2 | 0.70 | 0.85 | 0.80 | 0.70 | 0.80 |
| t3 | 0.55 | 0.60 | 0.85 | 0.80 | 0.80 |
| t4 | 0.65 | 0.65 | 0.90 | 0.60 | 0.65 |
Table 3: Cut-off value per assignment vector.
Where the
| Token | E1 | E2 | E3 | E4 |
|---|---|---|---|---|
| t1 | +0.15 | 0.00 | −0.05 | −0.25 |
| t2 | −0.10 | +0.05 | 0.00 | −0.10 |
| t3 | −0.25 | −0.20 | +0.05 | 0.00 |
| t4 | 0.00 | 0.00 | +0.25 | −0.05 |
Table 4: The margin vector of each expert (one column each).
We can sort these margin vectors from largest to smallest and determine our ideal pivot value. We know that each expert should have 1 token, but we can see that whereas E1 and E2 have 1 assignment each, E3 has 2 and E4 has none.
| E1 | E2 | E3 | E4 |
|---|---|---|---|
| +0.15 | +0.05 | +0.25 | 0.00 |
| 0.00 | 0.00 | +0.05 | −0.05 |
| −0.10 | 0.00 | 0.00 | −0.10 |
| −0.25 | −0.20 | −0.05 | −0.25 |
Table 5: The sorted vector for each expert to show the current pivot.
We can now get the 75th percentile value, in this case the second value for each:
| Expert | 75th percentile | New bias |
|---|---|---|
| E1 | 0.00 | 0.00 |
| E2 | 0.00 | 0.00 |
| E3 | +0.05 | −0.05 |
| E4 | −0.05 | +0.05 |
Table 6: Bias value of each expert computed from the sorted margin vectors.
Which gives us our bias values:
And after applying the bias to the router scores, the assignments are now well balanced:
| Token | E1 | E2 | E3 | E4 | Selected |
|---|---|---|---|---|---|
| t1 | 0.90 | 0.75 | 0.65 | 0.55 | E1 |
| t2 | 0.70 | 0.85 | 0.75 | 0.75 | E2 |
| t3 | 0.55 | 0.60 | 0.80 | 0.85 | E4 |
| t4 | 0.65 | 0.65 | 0.85 | 0.65 | E3 |
Table 7: Assignment post bias addition.
A few advantages of quantile balancing:
- We have the magnitude of the bias computed from the assignments, removing the need to ablate a
- There are no hyperparameters to tune.
Some implementation details that were left out of the above example for simplicity:
- The cut-off is computed from the scores plus the last batch's biases, since that is what decided the routing; the margins, however, use the raw scores
- We subtract the mean bias from all the biases to centre them at zero, so only differences between experts matter, not absolute values.
Similar to bias balancing, we compute the biases on one batch and apply them to the next to preserve causality. At inference, we must still apply the biases from the end of training, otherwise there can be an imbalance.
Measurements during training
We can calculate the assignments to each expert and the total number of assignments and then compute their ratios, which sum to one and give us the distribution of assignments over the experts. If we take the entropy of this
it tells us about the spread of token assignments over the experts. We want this distribution to have the entropy of a uniform distribution, which is routing_entropy_norm, which is
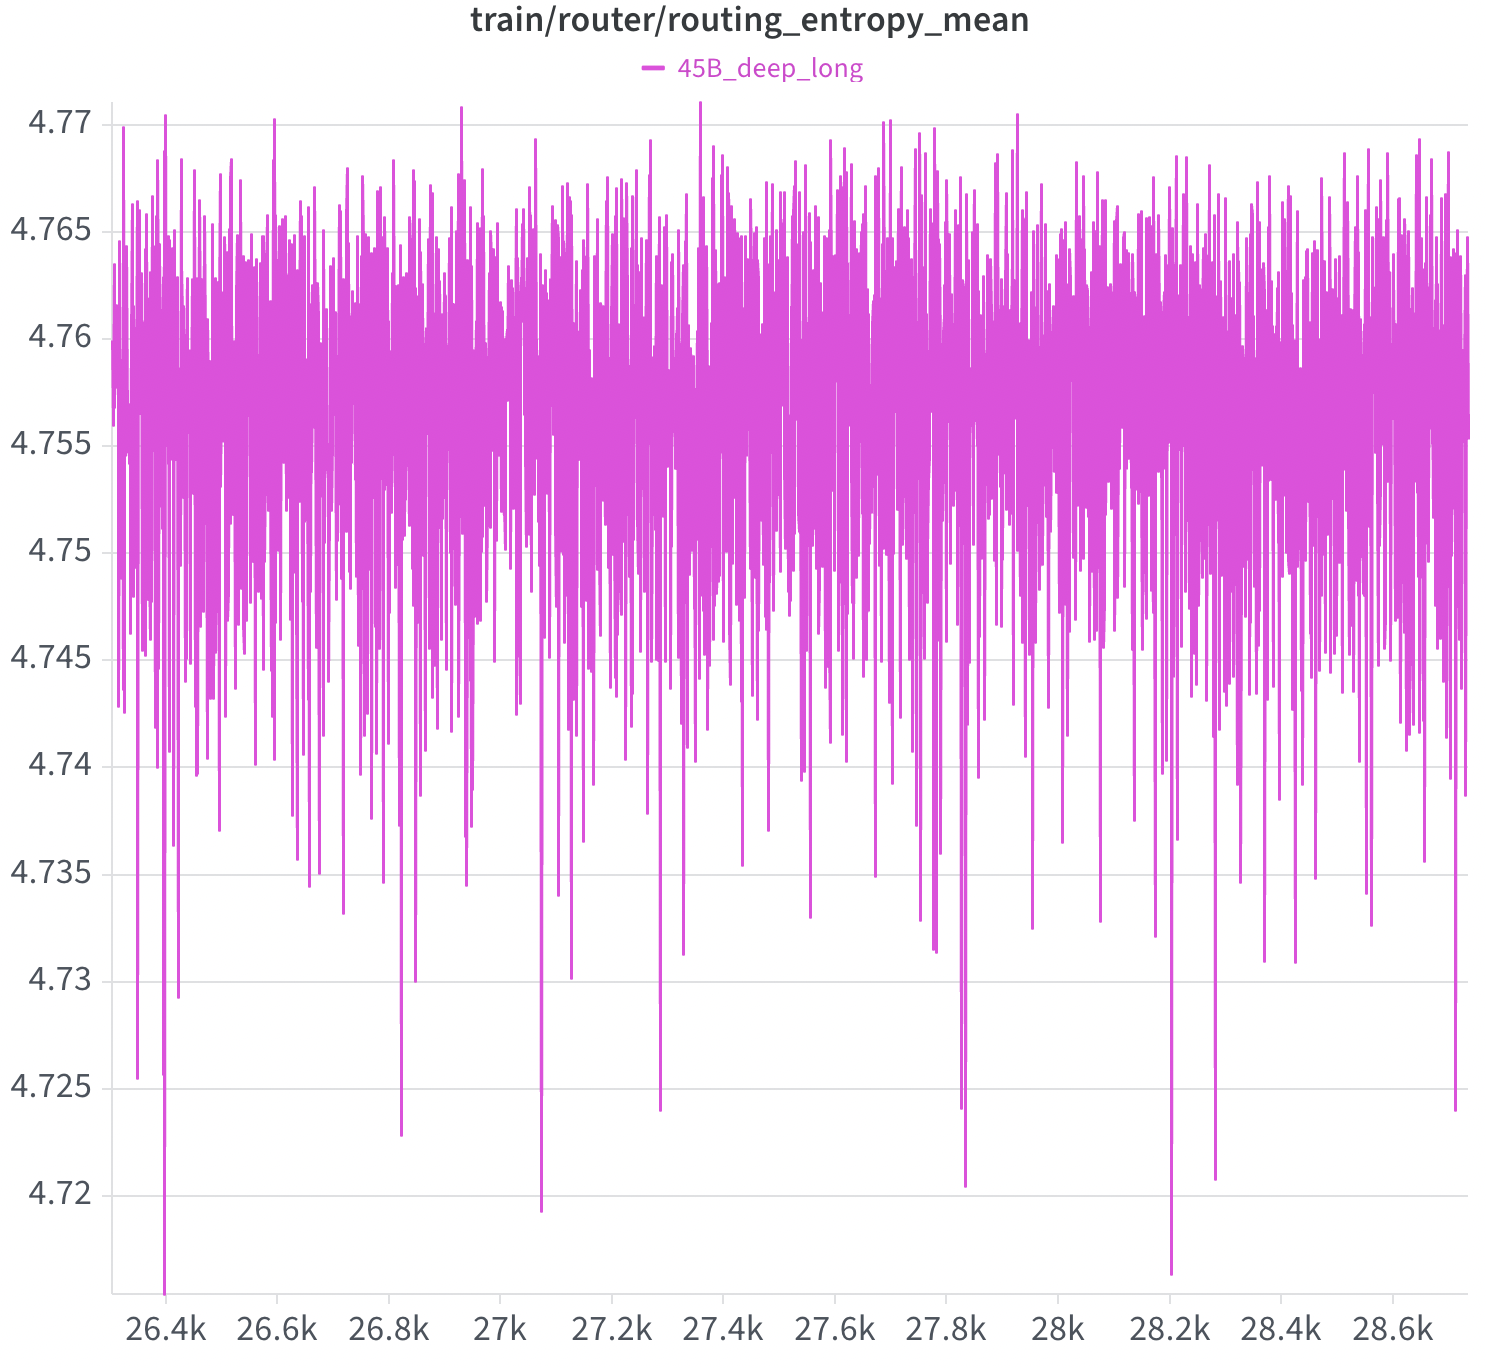
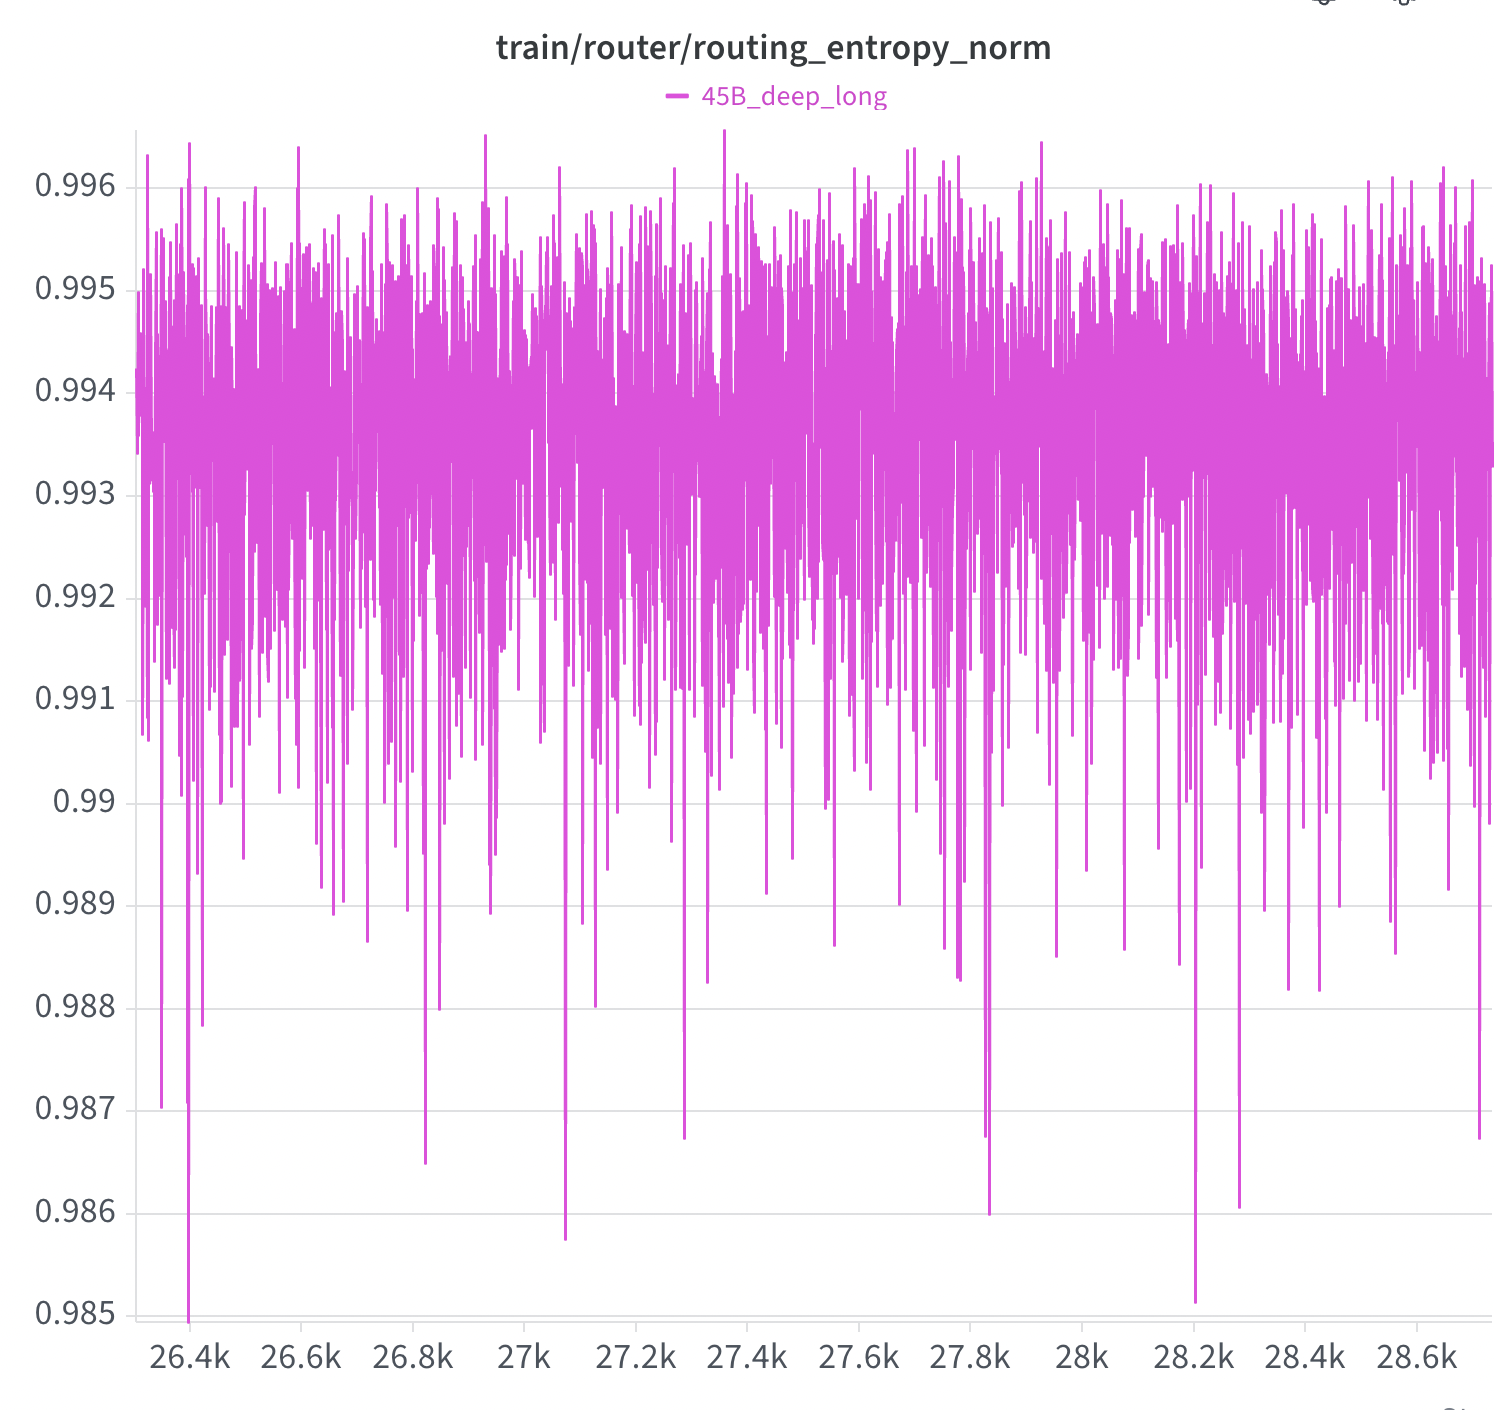
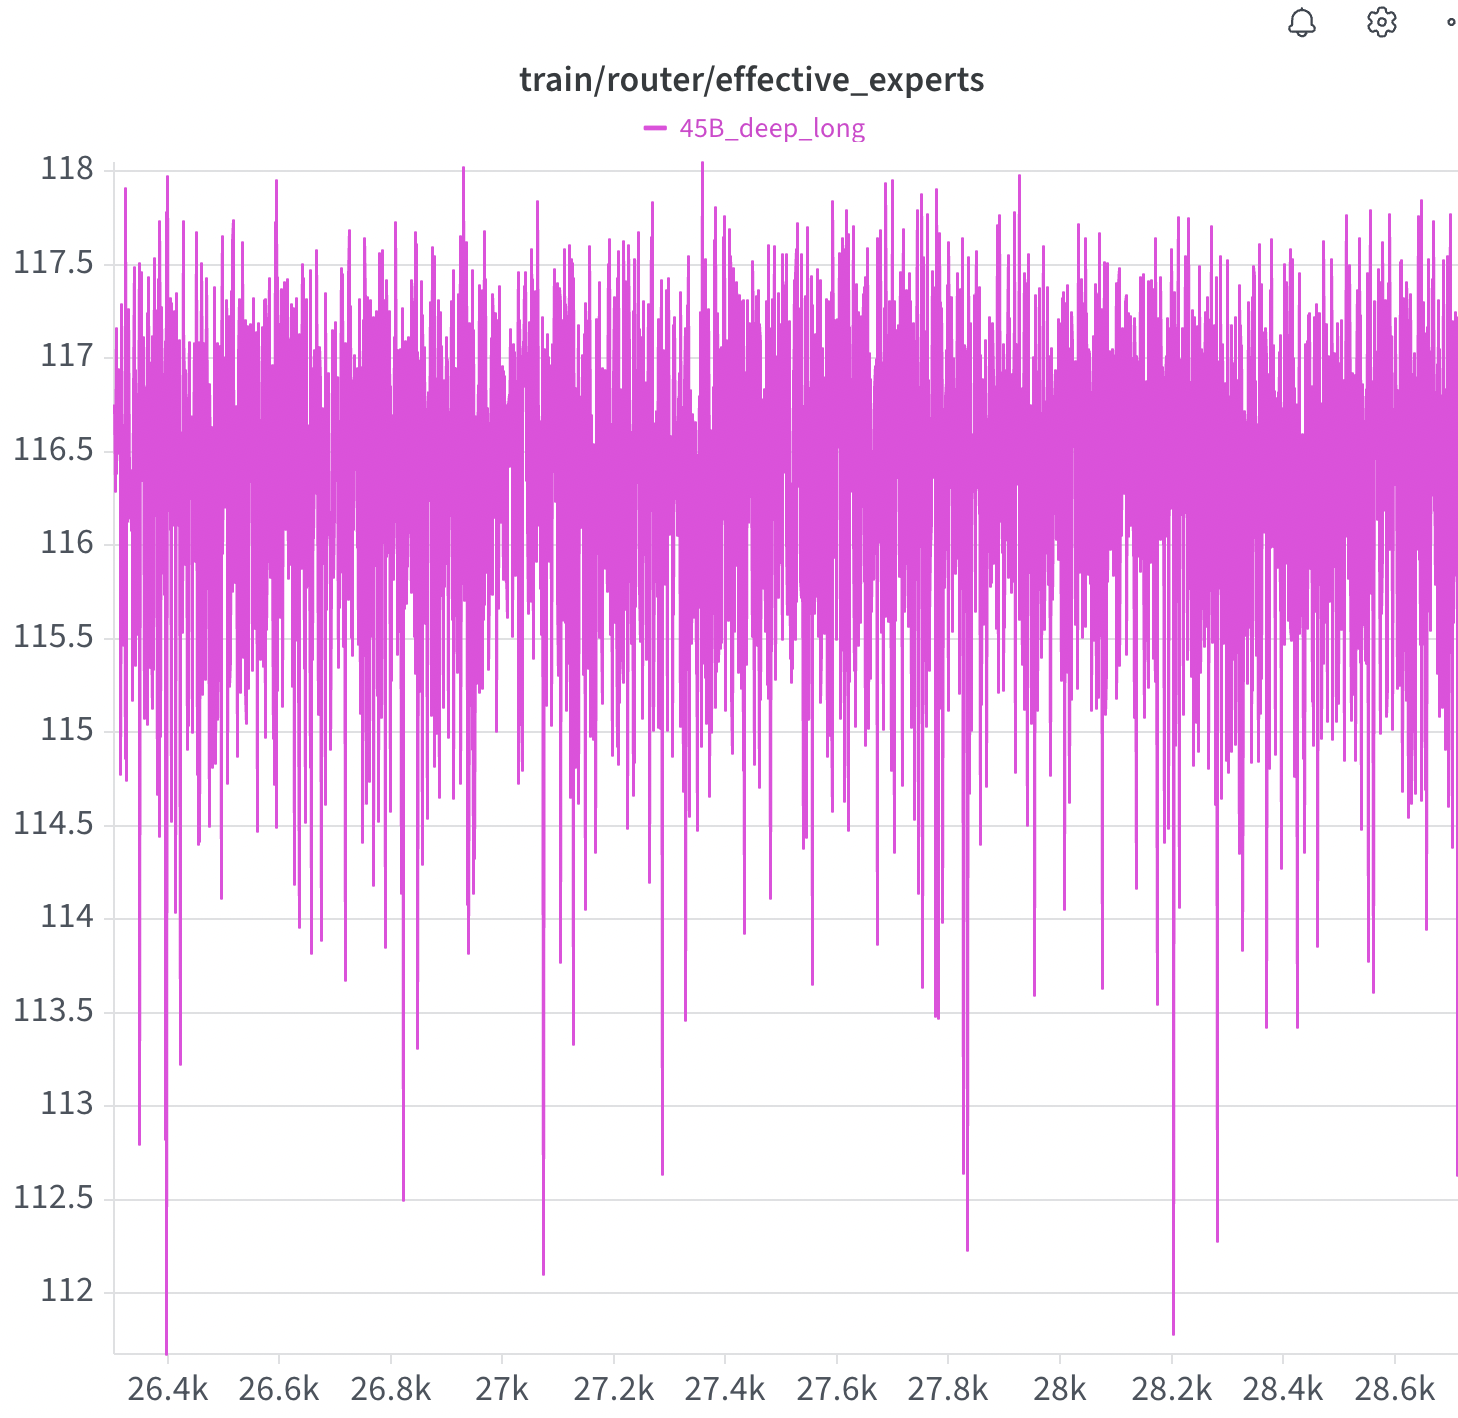
Figure 4: How effective experts, routing entropy norm and mean behave during training.
Note that we do not expect or get perfect balance per batch due to the fact that biases are computed for one batch and applied to the next, but on average across training, expert utilisation stays even and assignments don't get concentrated.