Nenya technical report
Nenya is a general purpose 0.5B active, 2.5B total parameter mixture-of-experts (MoE) base model. Nenya rivals Qwen3.5 2B on pretraining benchmarks with 500× lower training compute and 3.4× fewer active FLOPs/token. In this report, we share architecture details, model behaviour throughout training, benchmarks, insights into our runtime optimisations, and our training and data configurations. The model and the Mac implementation are available to play with through Hugging Face, as well as with pip install "nenya[mac]".
Model: https://huggingface.co/ArsalanZ/Nenya-2.5B-A0.5B-Base
Mac engine: https://huggingface.co/ArsalanZ/Nenya-2.5B-A0.5B-Base-Metal-8bit
Architecture overview
The architecture is the classical stack of token mixer and feed-forward transformer blocks that seamlessly incorporates mHC, Engram and MoE. Figure 1 shows the complete architecture.
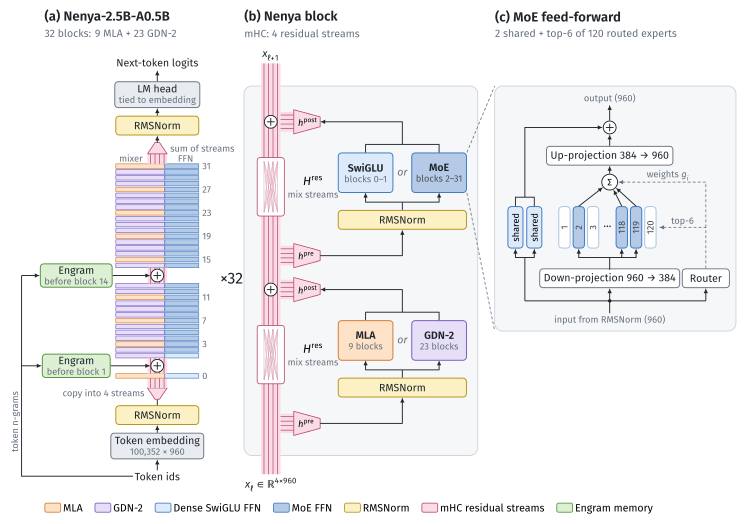
Figure 1: Nenya-2.5B-A0.5B detailed architecture diagram. All feed-forward blocks, including the experts, the shared experts and the dense feed-forward of blocks 0 and 1, are SwiGLU-style feed-forward networks.
Input text is tokenised with the Olmo 3 tokeniser and the embeddings are copied into four mHC residual streams and fed into the first transformer block. Each transformer block consists of a token mixer and a feed-forward MoE layer. Before each sublayer, there is a read operation,
Attention
Nenya uses two classes of token mixers, MLA and Gated DeltaNet-2. Figure 2 shows how we set up the Gated DeltaNet-2, while Figure 3 shows our MLA configuration.
Linear attention revolves around one core entity, the
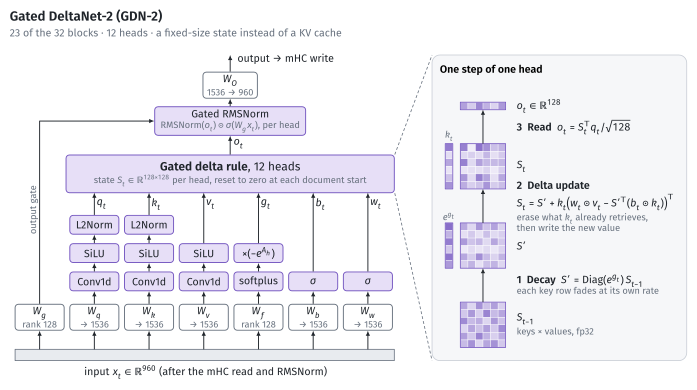
Figure 2: GDN-2 keeps a 128 × 128 state per head. Each token decays it per key channel, erases what the key already retrieves and writes the new value.
For MLA, the read from mHC is projected up by
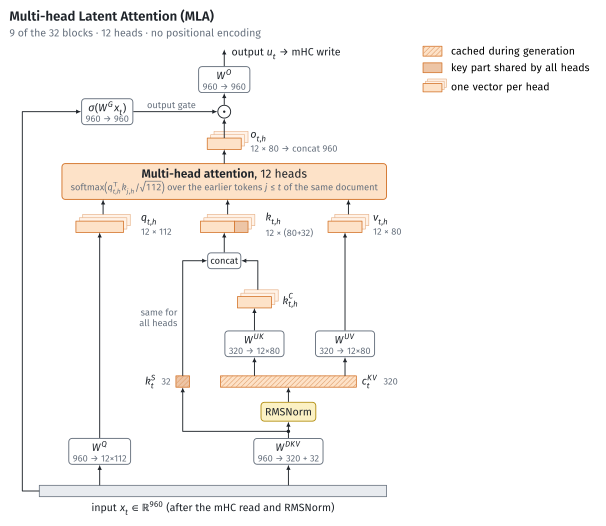
Figure 3: MLA caches a 320-d latent and a 32-d key shared by all heads: 352 numbers per token per layer.
mHC
Manifold-constrained hyper-connections (mHC) turn the vanilla single-channel residual stream into
Figure 4a looks at how stream spread varies with training. It's measured on the last block before the streams are summed and it's a measure of how different the streams are from each other, intended to measure stream collapse. We observe that the stream spread levels off to 0.3 after 20B tokens. This suggests that the extra channels are being useful and the model is putting different information in them.
Figure 4b compares the output of the sublayer with what's written into the stream by simply taking the ratio of RMS of the sublayer output and the stream write. We can see that attention output gets written into the stream at the same scale as its output, but feed-forward layers need to be scaled down as they are 2–6× larger so
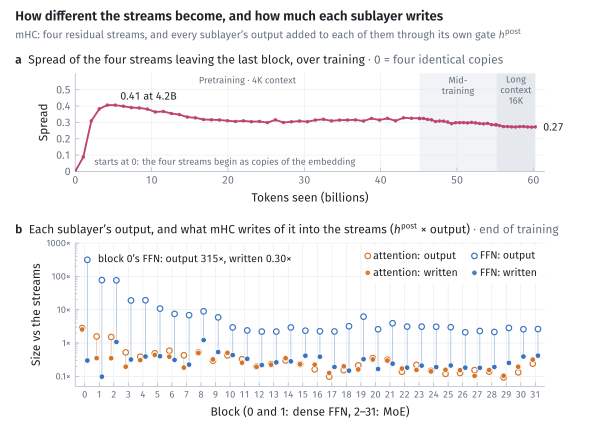
Figure 4: How different the four mHC residual streams become, and how much each sublayer writes into them. (a) The stream spread (metric in Appendix A1). (b) Each sublayer's output (hollow) and what mHC's write gate
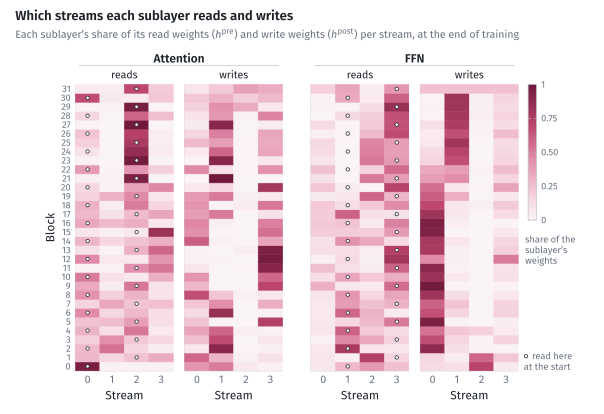
Figure 5: Which of the four streams each sublayer reads and writes: each sublayer's share per stream of its read weights (
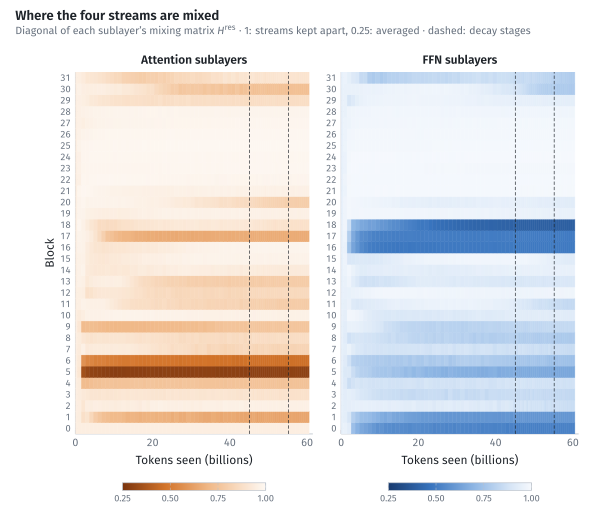
Figure 6: Where the four streams are mixed: mean of
Figure 5 shows which stream each sublayer reads from and writes into to assess stream specialisation. We can see a few patterns emerging:
- Both feed-forward and attention sublayers treat stream 2 as read-only.
- The feed-forward outputs written into stream 2 by blocks 0 and 1 are carried to the end, where they are heavily read by the attention sublayers from block 20 onwards, acting as a skip connection. This is likely the embedding vector being skipped deeper into the network: in other words, the 'embedding lane'.
- FFN sublayers treat streams 0 and 1 as write lanes, writing into stream 0 in the early and middle blocks and stream 1 in the late blocks. They treat streams 2 and 3 as the main read lanes.
Figure 6 shows the intensity of mixing across the blocks, per sublayer. It's the diagonal value in the mixing matrix, and 0.25 means complete averaging while 1 means zero mixing. The strongest mixing appears early in training: block 5's attention reaches 0.35 by 2.1B tokens, close to averaging all four streams, and the FFNs of blocks 16–17 and of the dense blocks 0–1 fall to 0.5–0.7 by 10B. For a few sublayers, mixing gets stronger with training: block 18's FFN (0.59 at 10B, 0.39 at the end), and, in the last blocks, block 30's attention (from 0.93 to 0.73) and its FFN (from 0.96 to 0.78), mostly late in pretraining and in midtraining. Interestingly, blocks 21–28 keep their streams apart throughout (≥ 0.95). Finally, there doesn't seem to be any visible pattern between mixing and reading from or writing to the residual streams.
From this, we can argue that the model is using the residual streams well by specialising them for reads and writes and keeping one as the embedding lane, while the mixing is more clustered than anticipated and has no obvious pattern. A downside of mHC is that it makes inference tedious as it introduces operations before and after sublayers. In our optimisations, we found mHC kernel launch overhead to be one of the main bottlenecks.
Engram
We follow the Engram approach of DeepSeek. We create bigram and trigram hashes from the token sequence, which hash into 8 bigram and 8 trigram tables respectively and fetch a total of 16 embedding vectors. These embedding vectors are projected to key and value vectors, and the key is dotted with each residual stream to give
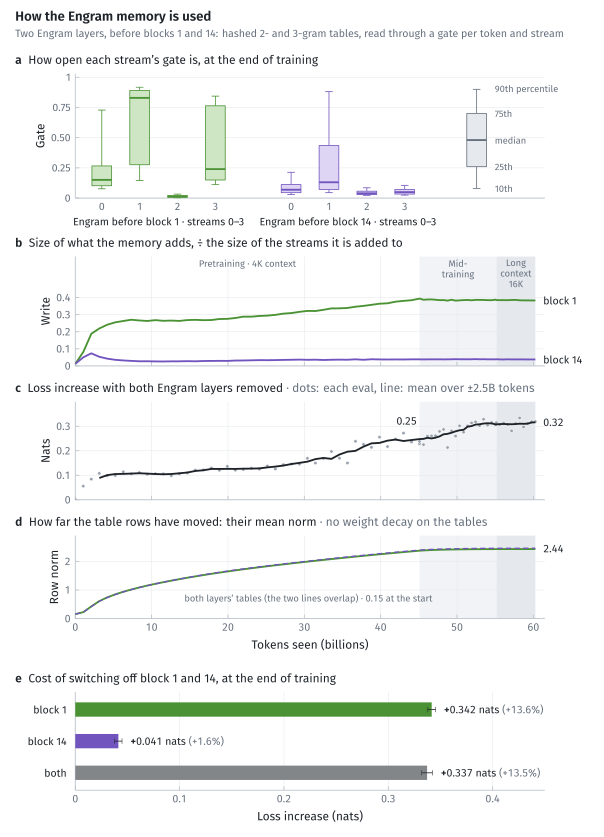
Figure 7: How the Engram memory is used. (a) How open the gates are (the
Figure 7a shows how open the gate
From Figure 7a, it is also clear that both blocks respect mHC stream 2 as the clean embedding skip lane and treat it as read-only, as the gates are almost closed here. Block 1 treats streams 0, 1 and 3 as the main write lanes it writes into, while block 14 writes mainly into streams 0 and 1.
From Figures 7c and 7d, we can see that the tables are learning throughout training. The L2 norm of the rows increases with training, growing a total of 16×, and the total cost of switching off both Engram blocks also rises with training and continues to do so. By the end, it costs about 13% of the total loss and is still increasing.
In summary, Engram seems to be very important for modelling capacity but would benefit from further ablations on where it should be placed deeper in the network. During inference, it is also very cheap as it's a lookup that can be pipelined with the attention and FFN layers.
MoE
Our MoE architecture is the fine-grained latent MoE architecture introduced in Kimi K3. We use 120 SwiGLU latent routed experts and two full-dimension SwiGLU shared experts. The final output is the sum of these. To stabilise the MoE during training, we use quantile balancing, as introduced by Kimi K3 and explained in our blog Quantile balancing. Figure 1c outlines the architecture in more detail.
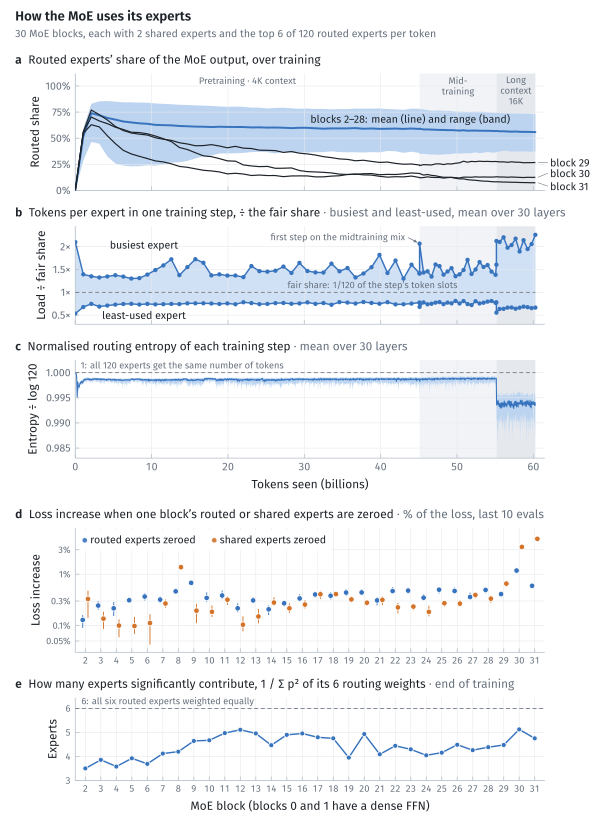
Figure 8: How the MoE uses its experts. (a) The routed experts' share (metric in Appendix A6) settles at 37–73% in blocks 2–28, while blocks 29–31 move to their shared experts: block 31's routed share falls from 63% to 7%. (b) The busiest expert (metric in Appendix A7) gets 1.43× its fair share and the least-used 0.75×. (c) The routing entropy (metric in Appendix A8) stays close to its maximum of 1: a median of 0.999 in pretraining and 0.994 in long context, as even as 119 and 116 equally used experts. (d) What zeroing a block's shared or routed experts costs, as a percentage of the loss. (e) The top routing weight (metric in Appendix A9) takes 29–49% of a token's six, so 3.5–5.1 experts act per token, fewest in the first MoE blocks.
Figure 8a shows the routed experts' share of the MoE output, which tells us how dominant they are as training progresses. For blocks 2–28, by the end of the 60B tokens, the routed share is about 50% of the final output, while for blocks 29–31 the routed share is below 25% of the MoE output, and block 31's routed share is 7% of the output. This measure of course doesn't point to usefulness, as we see from Figure 8d, but rather to how dominant the routed experts are.
Figure 8b shows how tokens in one training step are distributed across the experts. Given that we have 120 experts, each expert's fair share is 1/120 of the step's token slots. We find that the busiest expert gets 1.43× its fair share while the least busy expert gets 0.75× its fair share, and no expert goes without token allocation in any training step. We also notice that in long-context training, the spread between the busiest and least busy experts increases since more of the data is from a single source. Figure 8c shows the routing entropy, which stays close to the ideal value of 1. This points against any expert collapse during training.
Figure 8d shows how much the loss increases if we zero out either the shared-expert or routed-expert component of our MoE to help us assess their relative importance. We can observe a few patterns:
- It's clear that both the shared and the routed experts contribute to loss improvement.
- The contribution of both MoE components increases as we get deeper in the network.
- Routed experts (blue dots) for the majority of the blocks contribute more than the shared experts (orange dots).
- For blocks 30 and 31, the shared expert component contributes 3.5% and 4.9% of the loss, noticeably more than the routed component, likely due to their proximity to the output.
Since each of the experts is weighted by the softmax of router logits, Figure 8e shows how many experts contribute significantly, which tells us whether the router actually wants to use the experts it selects since quantile balancing could be forcing even selection, while the router could be switching them off with softmax weights. We can see that in the earlier layers, the top expert carries most of the weight, but with depth, we see roughly 4 active experts holding most of the weight, which is acceptable given each token picks 6.
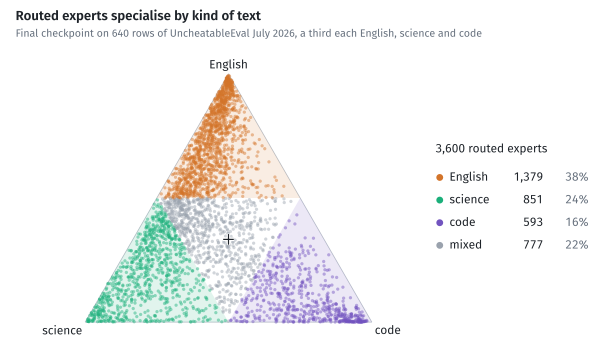
Figure 9: How the routed experts specialise by kind of text (metric in Appendix A10).
From Figure 9, we can see that our experts also specialise well across different domains such as English, science and code. Most specialise in English and science as that is the majority of our training data.
In summary, the model is utilising the shared and routed experts well with no apparent collapse. Switching off all shared experts across the network costs 104% of the val loss while switching off all routed experts costs 69% of the loss. The experts are also specialising in different domains, a behaviour we hoped to achieve.
Training schedule
Our training schedule consists of three stages: pretraining, midtraining and long-context training. These stages vary by the number of tokens they receive, context size and the LR regime. Pretraining lasts 45B tokens at peak LR, after 2B warmup tokens. At 45B, we kick in high-quality midtraining data and start to decay the LR with a
For our optimisers, we use AdamW and Muon as well as MuonBatched for the routed experts to make training efficient. Our experts are stored as 3-D tensors (of shape [120, 384, 768] for w_gate_up) so we can use batched matmul for faster computation. torch.optim.Muon is unable to handle these tensors and flattening to 2-D matrices would apply orthogonalisation incorrectly, so MuonBatched exists to handle this scenario. The first table lists the optimiser groups, their parameters and learning rates; the second, the training stages.
| Optimiser | Group | What is in it | Parameters | Peak LR | Weight decay |
|---|---|---|---|---|---|
| Muon | 2-D matrices | GDN-2 projections, experts, MLA, dense FFNs of blocks 0–1, Engram key/value projections, mHC mixing matrices | 373.3M (14.4%) | 3×10⁻³ | 0.08 |
| MuonBatched | Routed experts | w_gate_up and w_down of the 30 MoE layers, 120 experts each, one Newton–Schulz per expert |
1,592.5M (61.4%) | 3×10⁻³ | 0.08 |
| AdamW | Decay | Short-convolution kernels for GDN-2 & Engram | 0.45M (0.02%) | 6×10⁻⁴ | 0.4 |
| AdamW | No decay | Token embedding; MoE router 3.5M; norms, biases, GDN-2 A_log / dt_bias, mHC gains |
100.0M (3.9%) | 6×10⁻⁴ | 0 |
| AdamW | Engram tables | The two hashed n-gram tables | 528.4M (20.4%) | 3×10⁻³ | 0 |
| Total trained | 2,594.6M |
| Stage | Tokens | Context | LR multiplier (× each group's peak) | Optimiser state |
|---|---|---|---|---|
| Pretraining | 45.10B | 4,096 | Linear warmup for 2B tokens | New |
| Midtraining | 10.07B | 4,096 | A single |
Carried over from pretraining, no re-warmup |
| Long context | 5.10B | 16,384 | The same decay continues: 0.193 to 0.010 | Carried over from midtraining |
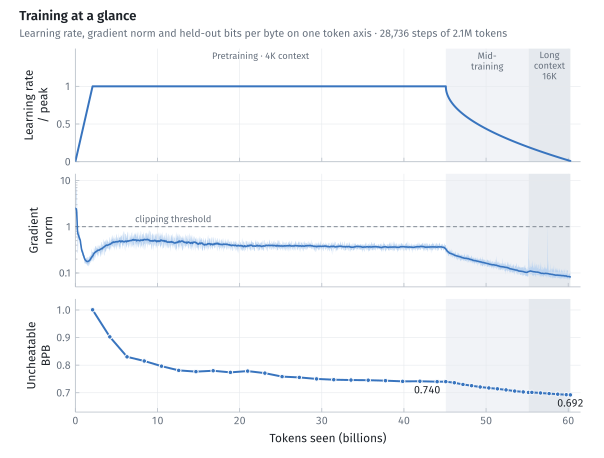
Figure 10: LR schedule, gradient norm and UncheatableEval bpb with tokens seen.
From Figure 10, we can see that the gradients behave well, and the UncheatableEval bpb decreases monotonically.
Performance analysis
To evaluate the model, we compare against some well-known open-source competitors in the same class. We evaluate the model on standard pretraining benchmarks as well as the July 2026 UncheatableEval data, published after every model's training cut-off. We also provide accuracy vs FLOPs/token and training compute plots.
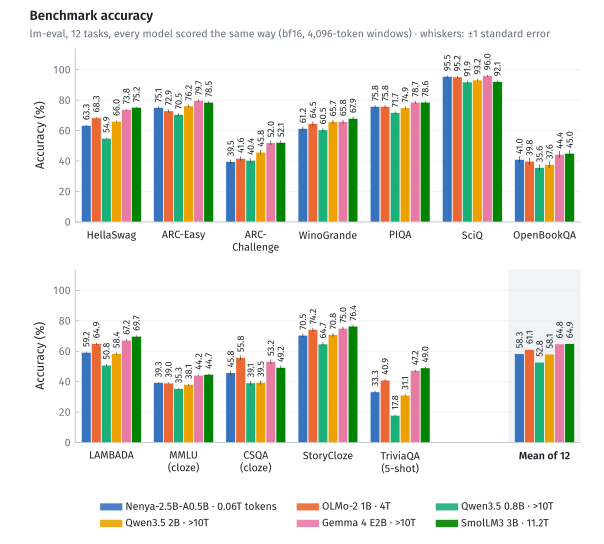
Figure 11: Pretraining benchmarks computed with lm-eval. Methodology described on our HF page. Training data was decontaminated against the 14 benchmark evaluation sets.
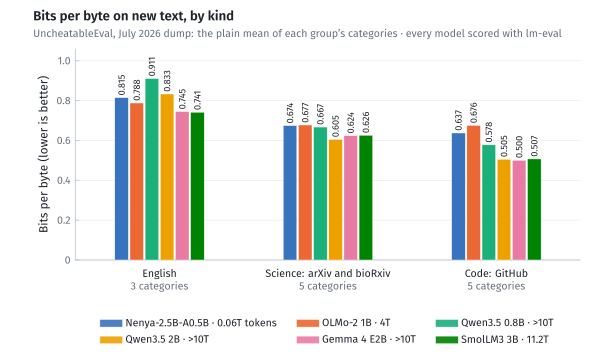
Figure 12: Bits per byte on the July 2026 UncheatableEval dataset, split by category.
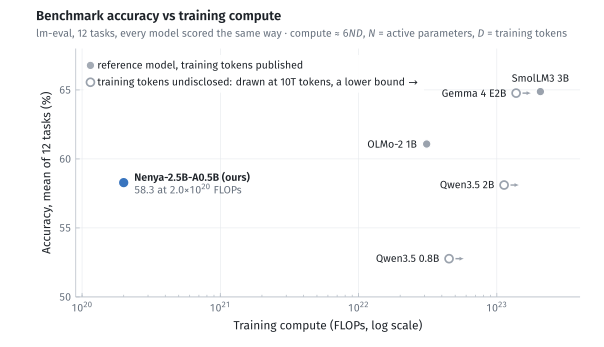
Figure 13: Accuracy (lm-eval, mean of 12 tasks) against estimated training compute
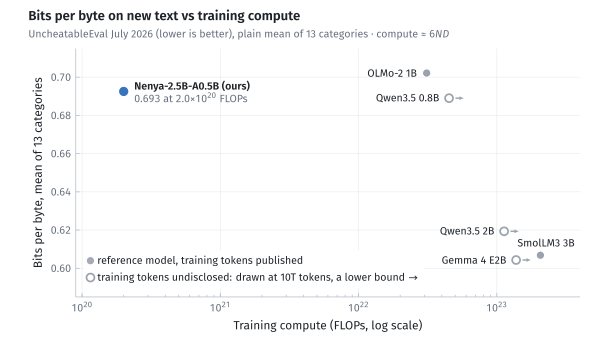
Figure 14: UncheatableEval bits per byte on text published in July 2026, after every model here was trained (plain mean of 13 categories, lower is better), against estimated training compute.
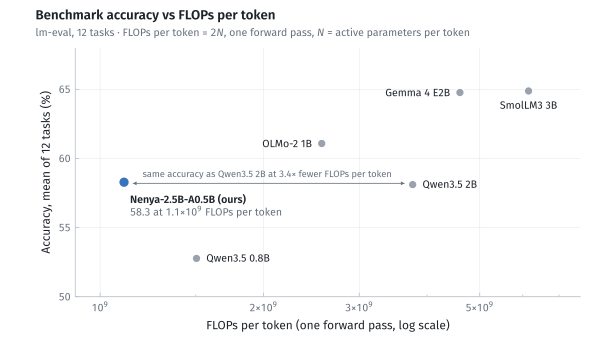
Figure 15: Accuracy against active FLOPs per token: one forward pass, 2 × active parameters, the cost of running the model. Nenya matches Qwen3.5 2B (58.3 vs 58.1) at 3.4× fewer FLOPs per token: 1.1×10⁹ vs 3.8×10⁹.
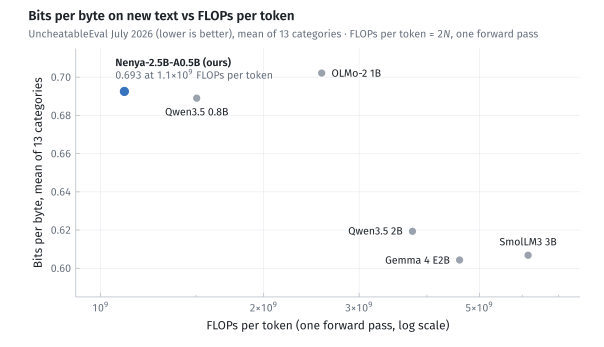
Figure 16: UncheatableEval July 2026 bits per byte against active FLOPs per token (one forward pass).
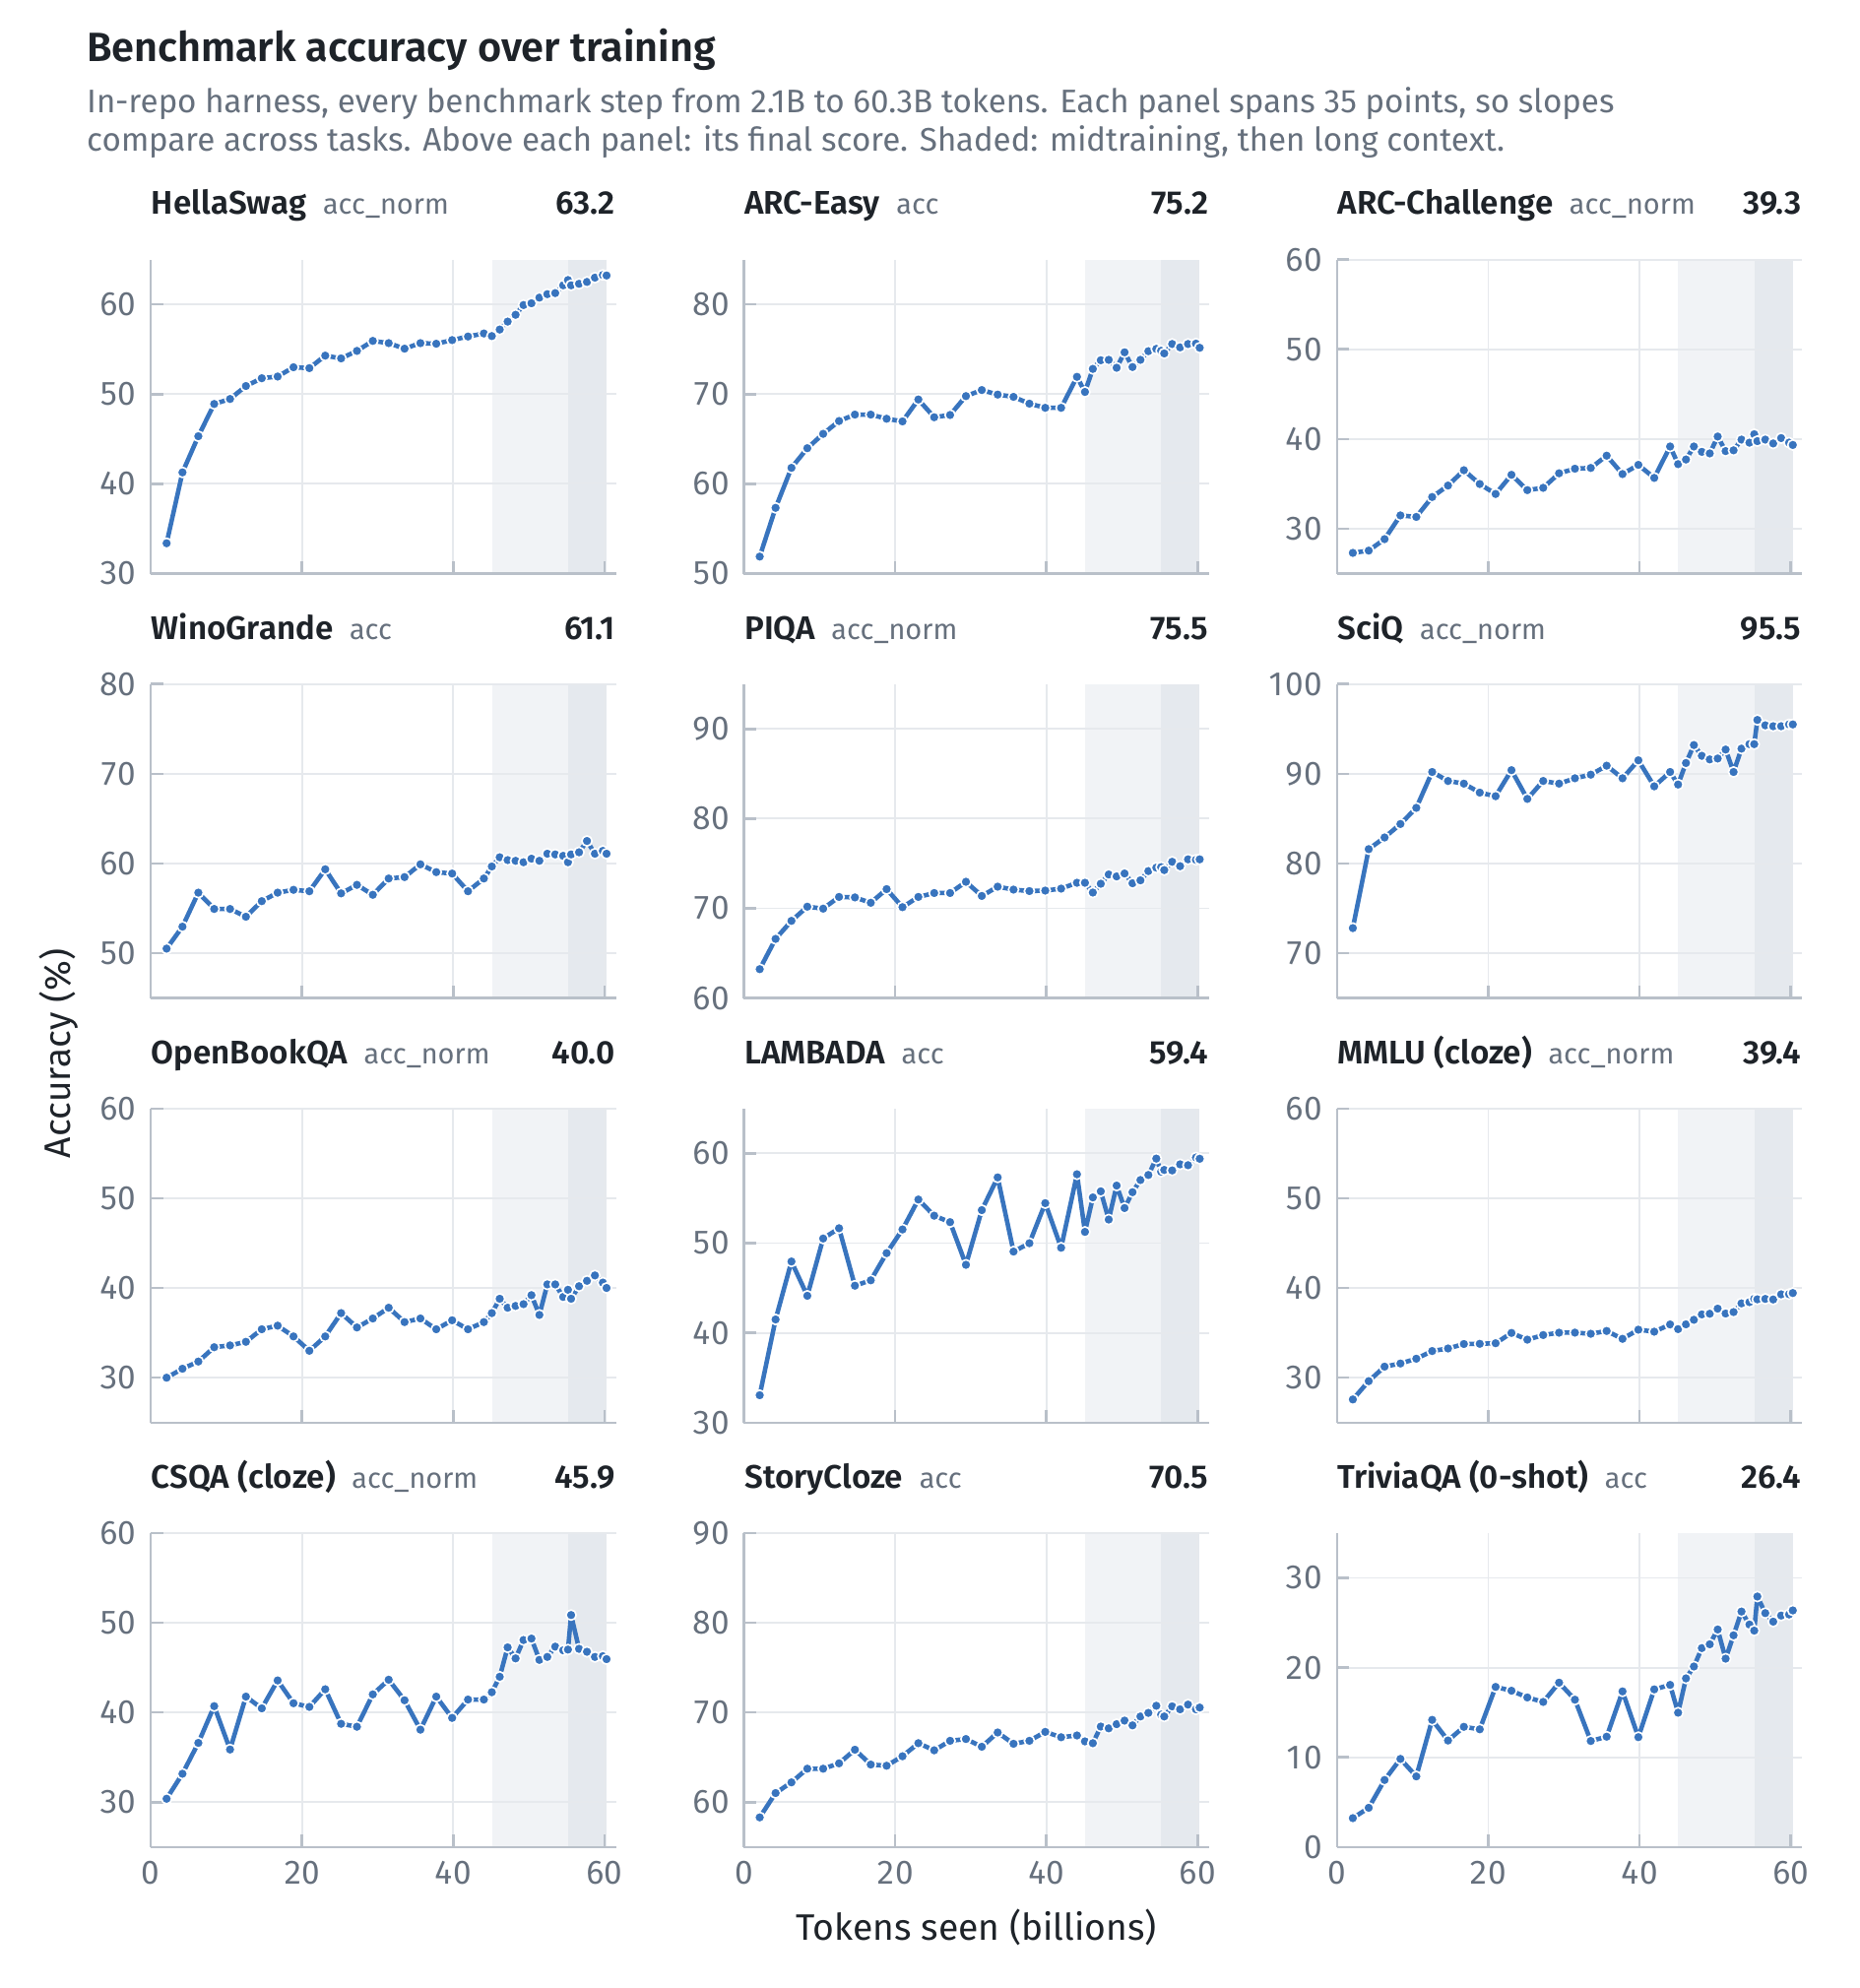
Figure 17: How individual tasks improve with tokens.
Figures 11 and 12 show that our model is competitive with Qwen3.5 2B, better than Qwen3.5 0.8B, but worse than Gemma 4 E2B, SmolLM3 3B and slightly worse than OLMo-2 1B on the standard pretraining benchmarks. As older validation sets have a possibility of being in the training data (though we explicitly decontaminate), we also show the UncheatableEval July 2026 bits per byte over three categories, on text published after every model's training cut-off. From this, we can see that Nenya does well on English, beating Qwen3.5 2B, but trails it by 11% on science and does worst on code. Nenya's UncheatableEval results can be partly explained by our training data distribution, which contains only 10% code and mostly web data.
From Figures 13–16, we can see that Nenya is an efficient learner, rivalling the likes of Qwen3.5 2B with ~500× lower training compute. For models that do not disclose their training token count, we assume 10T; however, it's likely 30T+ as that is what their last generations were trained on. What is more interesting for on-device agents is that it rivals Qwen3.5 2B with 3.4× fewer active FLOPs/token.
Figure 17 demonstrates how benchmark performance improves with token count. We can see that most tasks are still improving rapidly while PIQA and SciQ have saturated.
Optimised Mac implementation
A clear benefit of Nenya is its accuracy per active parameter. To materialise this, we provide v1 of our optimised Mac implementation. It can be installed through our pip package.
pip install "nenya[mac]"
import nenya
print(nenya.generate("The mitochondrion is the organelle responsible for", max_new_tokens=40))
print(nenya.generate("Question: What is the capital of Australia?\nAnswer:", max_new_tokens=8, temperature=0))
This section highlights the results on M1 (oldest) and M4 (newest-ish) Macs, and provides an overview of the optimisations made.
| Apple M4 (base) | Apple M1 (base) | |
|---|---|---|
| Model | Nenya-2.5B-A0.5B (the release) | Nenya-2.5B-A0.5B (the release) |
| Engine weight file | 3.47 GB | 3.47 GB |
| Decoding speed (tokens/s) | ||
| Empty context | 127.1 | 74.3 |
| 1K tokens | 123.9 | 72.5 |
| 4K tokens | 114.1 | 67.6 |
| 16K tokens | 92.5 | 55.5 |
| Peak memory while decoding | ||
| At 1K tokens | 4.10 GB | 4.07 GB |
| At 16K tokens | 4.30 GB | 4.26 GB |
| Without the weight file (1K / 16K) | 0.67 / 0.86 GB | 0.54 / 0.73 GB |
Prompt processing and time to first token on the Apple M4:
| Prompt length (tokens) | 16 | 64 | 256 | 1,024 | 4,096 | 16,384 |
|---|---|---|---|---|---|---|
| Time to first token (s) | 0.04 | 0.06 | 0.15 | 0.57 | 2.7 | 18.6 |
| Prompt processing (tokens/s) | 392 | 1,129 | 1,720 | 1,801 | 1,510 | 909 |
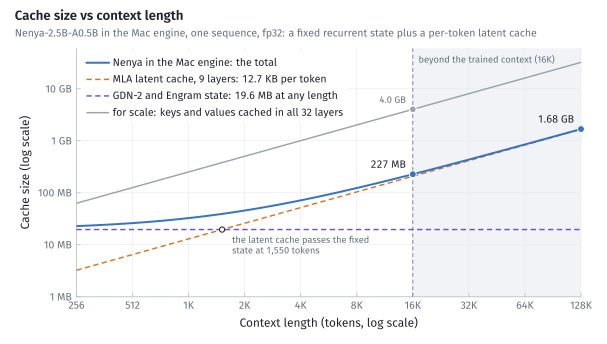
Figure 18: How total cache size varies with context size and its constituents. Note the cache is in fp32.
Figure 18 shows how the total cache size, and each of its parts, grows with context length. Note that the KV cache is still unoptimised in this release.
The Metal engine is Objective-C++ host code plus custom Metal GPU kernels. We found PyTorch (MPS backend) and MLX slower. We also found using the NPU slower for the following reasons:
- It doesn't support the routing, hashing and recurrent state requirements of our model, adding processor-switching overheads.
- On the roofline model, we are memory-bandwidth-bound, and the NPU and GPU share the same memory bandwidth.
For the Metal engine, we make the following optimisations:
-
Weights are stored and loaded in 8-bit with per-group scales and converted to fp16 after load to reduce memory bandwidth. The MoE router stays in fp32, as we found lower-precision routers did not reproduce the expert selection seen in training.
-
The LM head is the biggest cost per step, so we take a multi-pass approach: we score every vocabulary row with 4-bit weights and, after a selection step, rescore a subset in fp16. This enables fp16 precision at 4-bit cost.
-
Where possible, we merge and store matrices that act on one input together. For example, for the seven Gated DeltaNet-2 projections,
-
We keep all the work on the GPU to avoid processor-switching costs (GPU <-> NPU <-> CPU), and token-reading work on the CPU is pipelined with GPU processing.
-
We fuse each major operation into a single kernel to avoid kernel launch overheads. The convolution, gates, decay, normalisation, recurrence and gated norm of GDN-2 are one kernel; Engram hashing and table lookup are one kernel; and each mHC boundary is one kernel. At the start of optimisation, we found kernel launch overhead to be the biggest issue.
-
mHC between two sublayers computes 24 control parameters: 4 for the read, 4 for the write and 16 for the mixing matrix. The following sublayer is blocked until these can be computed, which takes about 25 µs on the critical path but happens 64 times per token. We use the linearity of the mHC computation to unblock the next sublayer computation, reducing the 25 µs to 10 µs.
-
For long context, we use a FlashMLA-style attention kernel with 64-row tiles, a running softmax and each cache value read once per phase.
There are several optimisations still to be made in quantisation, Engram memory layout, mHC orthogonalisation, arithmetic operations and the KV cache, but we defer those to v2 of the engine.
Pretraining data mix
Figure 19 shows the dataset category composition we used for training.
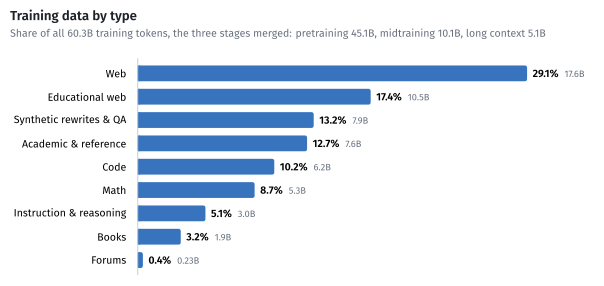
Figure 19: Dataset category composition.
Packing: For each source, we join the documents into a long token stream, separated by EOT tokens. We cut this stream into 4,096-token rows. Each mini-batch takes rows from different categories of our training data so we maintain the mix shown in Figure 19. We also shuffle each mini-batch. We call this source packing. For instruction data, we want each question/answer pair inside one 4,096-token row, so we pack whole Q/A pairs and pad any leftover token slots instead of cutting a pair.
Document masking: Training rows can hold multiple documents in the same 4,096-token training window, so we apply document masking to stop the model looking across the boundaries and polluting the context. The EOT token decides the document boundaries. For MLA, we apply block-diagonal masking to limit the keys each query attends to, using varlen kernels from FlashAttention. For Gated DeltaNet-2, we reset the recurrent state at the EOT token and for Engram, we stop the n-gram hashes at the document boundary and limit the convolutions too.
Decontamination: We match the questions and answers from the 14 benchmark evaluation sets against the training data. We take 13-word and 8-word windows of text, normalise them and hash them to compare against training data windows, and if we see benchmarks matching the training data, we cut out the matching span plus 200 characters either side. Documents with more than 5 matches, and synthetic, instruction and code documents, are dropped whole, as cutting would leave broken examples unfit for training.
Deduplication: We keep one dedup index per training stage, shared by every source, which every document is checked against. We key documents with a 128-bit hash, and drop every subsequent copy where the hash matches. Web sources are deduped by their normalised URL so the same page formatted differently doesn't sneak in. In total, we remove 7.6–9.3% of documents per stage as exact duplicates, almost all of them Stack-Edu files that our source data stores several times.
Model configuration
Nenya has the following configuration.
| ARCHITECTURE DETAILS | |
|---|---|
| Total Parameters | 2.59B |
| Activated Parameters | 553M |
| Routed-Expert Parameters | 1.59B (6 of 120 experts run per token) |
| Engram Table Parameters | 528M |
| Number of Layers | 32 |
| Number of Dense Layers | 2 (blocks 0 and 1) |
| Attention-Layer Composition | 23 Gated DeltaNet-2 (GDN-2) + 9 Multi-head Latent Attention (MLA), the MLA at blocks 0, 3, 7, 11, 15, 19, 23, 27, 31 |
| Attention Hidden Dimension ( |
960 |
| Number of Attention Heads | 12 (for both attention types) |
| MLA | Normalised 320-dim key/value latent plus a 32-dim key shared by all heads |
| GDN-2 | Head Dimension 128 |
| Dense FFN Hidden Dimension | 2,560 (SwiGLU) |
| Latent MoE Dimension | 384 |
| MoE Hidden Dimension (per Expert) | 384 |
| Number of Experts | 120 |
| Selected Experts per Token | 6 |
| Number of Shared Experts | 2 |
| MoE Balancing | Quantile Balanced |
| Engram Memory | Before blocks 1 and 14; 8 hash heads per order |
| Residual Streams | 4 |
| Vocabulary Size | 100,278 |
| Padding Rows | 74 |
| Context Length | 16,384 |
| Attention Mechanism | GDN-2 & MLA |
| Activation Function | SwiGLU |
| Precision | bf16 |
| Modality | Text |
| Positional Encoding | None |
Summary and reflections
Is Nenya interesting? mHC, Engram and MoE are acting synergistically to do something interesting, and the ability to rival larger models with significantly lower training compute and FLOPs/token should not go unnoticed. We could argue that most benchmark gains come early and training for another 10T tokens won't help, but the benchmark vs token trajectories of OLMoE, TinyLlama and Pythia show that it is not true. It also wouldn't explain the competitive bpb on unseen text.
For future models, there are clear issues we aim to solve:
-
Training warmup was a little longer than necessary; we could get away with 250 steps as the model is generally quite stable.
-
A context size of 16K works for many use cases, but for long running agents, 128K+ would be ideal.
-
The placement of the block 14 Engram should be optimised, or its parameters allocated elsewhere.
-
We should have added an RMSNorm after each FFN to control the scale of its output.
-
We have not yet computed scaling laws for this architecture.
Appendix
A1. How stream spread is calculated (Figure 4a)
For each of the
A spread of 0 means the four streams are identical.
A2. How the read and write shares are computed (Figure 5)
For every token
The read weights set how much of each stream goes into the mix the sublayer reads; the write weights set how much of its output is added to each stream. Both are averaged over tokens, and each stream's average is divided by the sum over the four streams:
Each sublayer's four shares add up to 1. A write share is exactly the fraction of the sublayer's output that lands in stream
A3. Mixing-matrix diagonal (Figure 6)
For every token
The identity matrix, which leaves the streams unmixed, gives 1; the uniform matrix, which replaces every stream with the average of all four, gives 0.25.
A4. Memory size relative to the streams (Figure 7b)
For one Engram layer, let
A ratio of 0.38 means the memory adds 38% of the streams' size.
A5. Table row norm (Figure 7d)
For each token, each Engram layer reads one 60-value row from each of its 16 hash tables (8 bigram and 8 trigram), 960 values in total. Figure 7d shows the mean L2 norm of the
A6. Routed share (Figure 8a)
For one MoE block, let
A7. Expert load (Figure 8b)
An optimiser step trains on
The 1.43× and 0.75× quoted for pretraining are the medians over its evals.
A8. Routing entropy (Figure 8c)
With
A9. Routed experts in effect (Figure 8e)
Token
which is 6 when the weights are equal and 1 when one expert takes all the weight. The plot shows its mean over the last 10 evals.
A10. Expert specialisation (Figure 9)
The final checkpoint is run on 640 rows of 1,024 tokens of UncheatableEval July 2026, a third each English, science and code. For each routed expert
Each of the 3,600 routed experts (120 in each of the 30 MoE blocks) is a dot at
A11. FLOPs per token and training compute (Figures 13–16)
A forward pass costs one multiply and one add per active weight, and the backward pass about twice that, so with
Attention-score FLOPs, which grow with context, are left out for every model; at 4K context they would add about 10% for the dense models and a few percent for the hybrids. Qwen3.5 and Gemma 4 do not publish
A12. Benchmark tables
Active parameters are the weights each token is multiplied by, as used for the compute estimates in Figures 13–16; total parameters are all stored weights. Training FLOPs are
| Model | Training tokens | Active parameters | Total parameters | Training FLOPs |
|---|---|---|---|---|
| Nenya | 0.06T | 0.55B | 2.59B | 2.0 × 10²⁰ |
| OLMo-2 1B | 4.05T | 1.28B | 1.48B | 3.1 × 10²² |
| Qwen3.5 0.8B | >10T (est.) | 0.75B | 0.87B | ≥ 4.5 × 10²² |
| Qwen3.5 2B | >10T (est.) | 1.88B | 2.27B | ≥ 1.1 × 10²³ |
| Gemma 4 E2B | >10T (est.) | 2.30B | 5.12B | ≥ 1.4 × 10²³ |
| SmolLM3 3B | 11.2T | 3.08B | 3.08B | 2.1 × 10²³ |
On the standard pretraining benchmarks, the model achieves the following. Accuracies are in %, ± one standard error.
| lm-eval task | Metric | Nenya (0.06T tokens) | OLMo-2 1B (4T tokens) | Qwen3.5 0.8B (>10T tokens) | Qwen3.5 2B (>10T tokens) | Gemma 4 E2B (>10T tokens) | SmolLM3 3B (11.2T tokens) |
|---|---|---|---|---|---|---|---|
hellaswag |
acc_norm | 63.3 ± 0.5 | 68.3 ± 0.5 | 54.9 ± 0.5 | 66.0 ± 0.5 | 73.8 ± 0.4 | 75.2 ± 0.4 |
arc_easy |
acc | 75.1 ± 0.9 | 72.9 ± 0.9 | 70.5 ± 0.9 | 76.2 ± 0.9 | 79.7 ± 0.8 | 78.5 ± 0.8 |
arc_challenge |
acc_norm | 39.5 ± 1.4 | 41.6 ± 1.4 | 40.4 ± 1.4 | 45.8 ± 1.5 | 52.0 ± 1.5 | 52.1 ± 1.5 |
winogrande |
acc | 61.2 ± 1.4 | 64.5 ± 1.3 | 60.5 ± 1.4 | 65.7 ± 1.3 | 65.8 ± 1.3 | 67.9 ± 1.3 |
piqa |
acc_norm | 75.8 ± 1.0 | 75.8 ± 1.0 | 71.7 ± 1.1 | 74.9 ± 1.0 | 78.7 ± 1.0 | 78.6 ± 1.0 |
sciq |
acc_norm | 95.5 ± 0.7 | 95.2 ± 0.7 | 91.9 ± 0.9 | 93.2 ± 0.8 | 96.0 ± 0.6 | 92.1 ± 0.9 |
openbookqa |
acc_norm | 41.0 ± 2.2 | 39.8 ± 2.2 | 35.6 ± 2.1 | 37.6 ± 2.2 | 44.4 ± 2.2 | 45.0 ± 2.2 |
lambada_openai |
acc | 59.2 ± 0.7 | 64.9 ± 0.7 | 50.8 ± 0.7 | 58.4 ± 0.7 | 67.2 ± 0.7 | 69.7 ± 0.6 |
mmlu_cloze |
acc_norm | 39.3 ± 0.4 | 39.0 ± 0.4 | 35.3 ± 0.4 | 38.1 ± 0.4 | 44.2 ± 0.4 | 44.7 ± 0.4 |
csqa_cloze |
acc_norm | 45.8 ± 1.4 | 55.8 ± 1.4 | 39.1 ± 1.4 | 39.5 ± 1.4 | 53.2 ± 1.4 | 49.2 ± 1.4 |
xstorycloze_en |
acc | 70.5 ± 1.2 | 74.2 ± 1.1 | 64.7 ± 1.2 | 70.8 ± 1.2 | 75.0 ± 1.1 | 76.4 ± 1.1 |
triviaqa_5shot_greedy |
acc | 33.3 ± 0.7 | 40.9 ± 0.8 | 17.8 ± 0.6 | 31.1 ± 0.7 | 47.2 ± 0.8 | 49.0 ± 0.8 |
| avg | mean of all | 58.3 | 61.1 | 52.8 | 58.1 | 64.8 | 64.9 |
On UncheatableEval (July 2026), grouped by category, the model scores the following bits per byte (lower is better).
| Group | Nenya (0.06T tokens) | OLMo-2 1B (4T tokens) | Qwen3.5 0.8B (>10T tokens) | Qwen3.5 2B (>10T tokens) | Gemma 4 E2B (>10T tokens) | SmolLM3 3B (11.2T tokens) |
|---|---|---|---|---|---|---|
| English (3 categories) | 0.815 | 0.788 | 0.911 | 0.833 | 0.745 | 0.741 |
| Science: arXiv and bioRxiv (5 categories) | 0.674 | 0.677 | 0.667 | 0.605 | 0.624 | 0.626 |
| Code: GitHub (5 categories) | 0.637 | 0.676 | 0.578 | 0.505 | 0.500 | 0.507 |
A13. GDN-2 inner workings
After the mHC read from the residual stream converts the 4-stream hidden state into a single stream,
Inputs
Our head dimension is
Gates
The decay gate, nn.Parameter learned for each head that does not depend on the token. We use a negative exponential to contain the value between 0 and 1 as it's a decay gate:
The erase gate,
The write gate,
State update (
Decay first:
Each key row of the memory fades at its own rate, set by the decay gate
Delta update:
Erase what the key
Read and output projection
Looks up the memory with the query: a weighted mix of the values whose keys are similar to
Normalises each head's output, gates it per channel by the token, and projects it back to the model width.